

Disaster Hype Lags Futures Markets
To to get some really hard news and to get ahead of the hype, look to futures markets.

There was news yesterday that the Russians and Ukrainians came to some accommodation over grain exports out of Odessa. Within hours of that, some number of Russian missiles streamed into the port. Did the missile strike cripple port capacity?
That is not obvious, and it has been the case that the Russians have been taking shots at Odessa for some time. Those earlier strikes did not cripple the port, but the latest ones have? It is not obvious what the news means.
Meanwhile, to get some really hard news, I’d recommend periodically scanning futures markets. Here is a site I like: https://www.barchart.com/futures
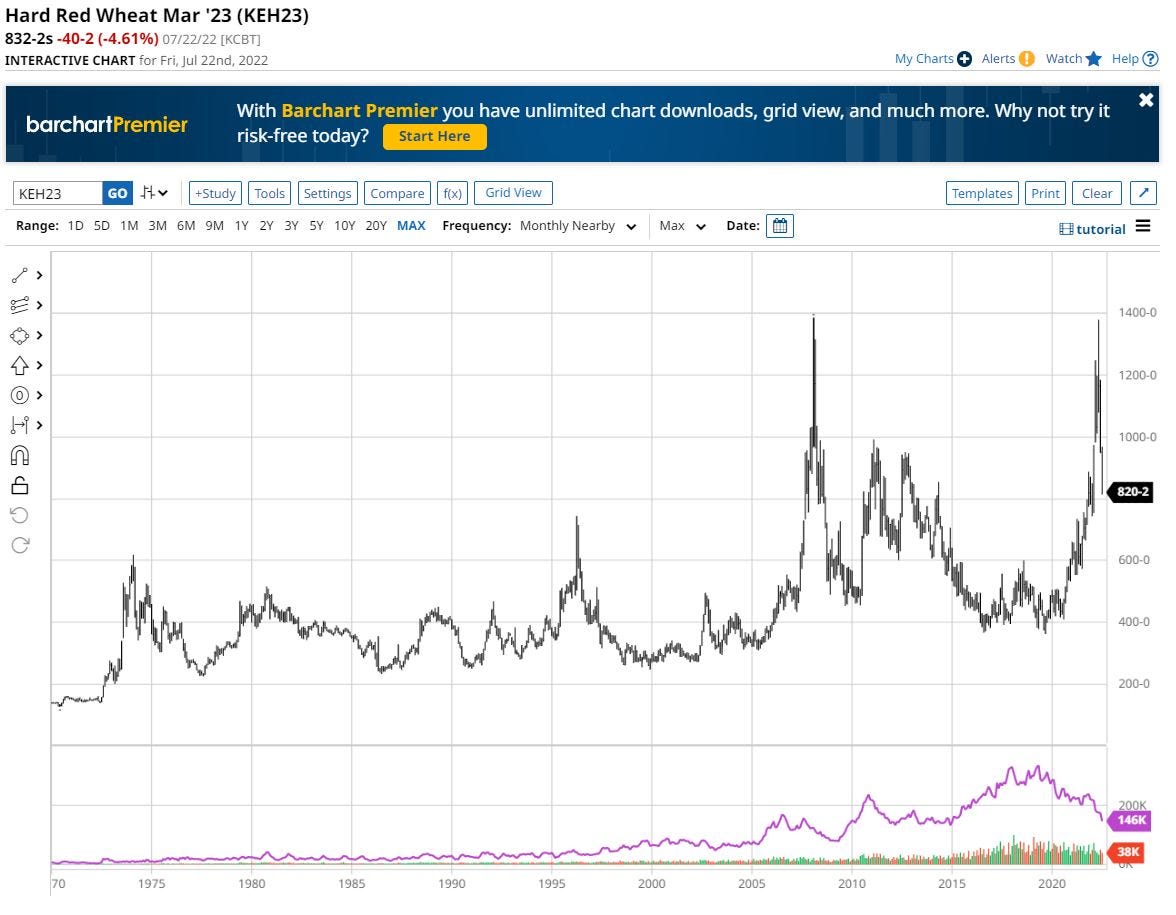
Let’s look at prices for Hard Red Wheat set for delivery in March 2023 (https://www.barchart.com/futures/quotes/KEH23/interactive-chart):
This graph indicates prices going back to late January of this year, just before hostilities broke out in Ukraine. “KC” indicates “Kansas City”. Futures markets for wheat are organized in KC or Chicago. These cities are important nodes in east-west logistical networks.
The magenta line indicates trade volume. It looks like commercial flour mills are setting themselves up for production in the spring. It turns out that flour markets are seasonal. Flour millers anticipate two annual peaks in retail demand from commercial bakeries, a pre-holiday season peak (the middle of autumn), and a spring-time peak that anticipates summer demands for hotdog and hamburger buns. Who knew?
“Hard” wheat has higher protein (gluten) content than “soft” wheat. It is thus better suited for products that require more substance and texture: flours for pizza, bagels, and crusty breads. And noodles! Enormous volumes of hard wheat get shipped off to East Asia. Mile-long trains pick up the wheat in Montana. Ships dedicated to the bulk shipment of wheat absorb all that wheat at dedicated wheat shipping terminals on the Columbia River near Portland, Oregon. That stuff heads out across the Pacific. In contrast, soft wheat goes into flours for less chewy things like cakes and muffins.
Bulk shipping of wheat at the EGT facility in Longview, Washington on the Columbia River
Ukraine has been an important wheat-growing region for thousands of years. Even I had stumbled upon contracts from the 1340’s—that’s right; the 14th century—by which Venetian merchants had set out for their trade colony of Tana near the mouth of the Don River (the present day Taganrog?) to secure wheat. Colder seasons had devastated wheat yields in Italy. The entire peninsula was suffering through famine. The authorities in Venice had to source grain from elsewhere. Plucky merchants based in Crete obliged them, venturing into the Black Sea to pick up grain for re-export from Crete to Venice.
By 1350, the Venetians and Genoese were fighting a war over access to the Black Sea, and neither for the first nor last time, but that is a story for another essay. For now. we can wonder if we can discern any effects of the current war on wheat prices.
Just eye-balling the graph above suggests that the war could be affecting things. Wheat markets have long been globalized, and Ukraine is an important supplier to those markets. But, granted, in any given year, one country or another may have a bad harvest. Harvests in Australia may prove to be poor. That would boost global prices. Production in Montana may falter. Prices for “hard” wheat may increase. Does the graph indicate anything exceptional? Let’s look back all the way to 1970:
The recent spike in prices is remarkable if not unprecedented. One can see that spike in prices starting in 2007 and into 2008. What caused that? The administration of George W. Bush got into the business of hyping biofuels while at the same time quietly boosting ethanol mandates. Farmers respond to incentives; massive swaths of land that might have been dedicated to wheat shifted to corn (the source of ethanol) as well as to other crops, such as soy beans. All that shifting amounted to farmers chasing after artificially-created “rents,” distortionary payoffs to middle America created by the Bush Administration. All this stuff was packaged as “green,” but, the reality is that juicing distillates (fuels such as gasoline) with ethanol derived from corn does not decrease carbon emissions. “Green” mandates, such as ethanol mandates, have merely amounted to ways of dressing up subsidies to agricultural interests both big and small.
What to get from all this? Markets have been more volatile since 2007. This year’s peak remains within the range of the last 15 years’ experience. But markets have also settled down over the last few months. It is not obvious that global wheat markets are too rattled by the ongoing war in Ukraine.
Let’s look at markets for lumber:
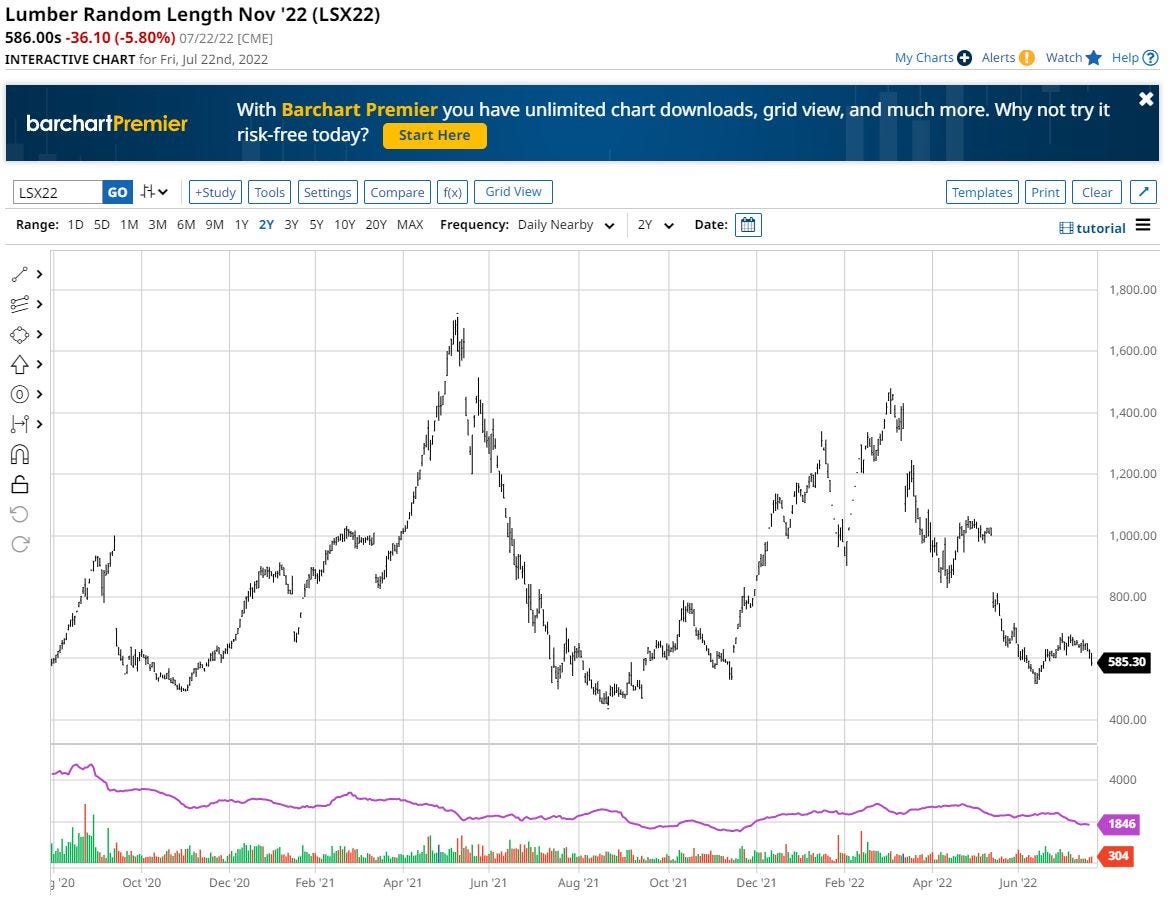
This graph gives us some insight into lumber prices going back two years.
I have had some personal interest in lumber markets, because my older siblings will be rebuilding a cabin in Northern Wisconsin. Our grandparents had built it in 1946. It is a handsome-looking structure. If it were up to me, we would preserve it. But, it is not up to me, which is fine. My siblings will replace the structure with something entirely new. But, they had started to plan the new construction just before prices sharply increased in the spring of 2021. But, by the end of the summer, prices had fallen back to levels of November 2020. What was going on?
Some observers suggest that the coronavirus phenomenon had induced much of the increase in lumber prices in 2021. People of some means were fleeing the cities and looking for larger homes where they could set up their home offices and spread out. True or not, the supply-side (the lumber mills) had become strained. Rising prices rationed demand. But, the mills brought idled milling capacity back online within the space of a few months. Prices crashed.
Let’s look back to 1970:
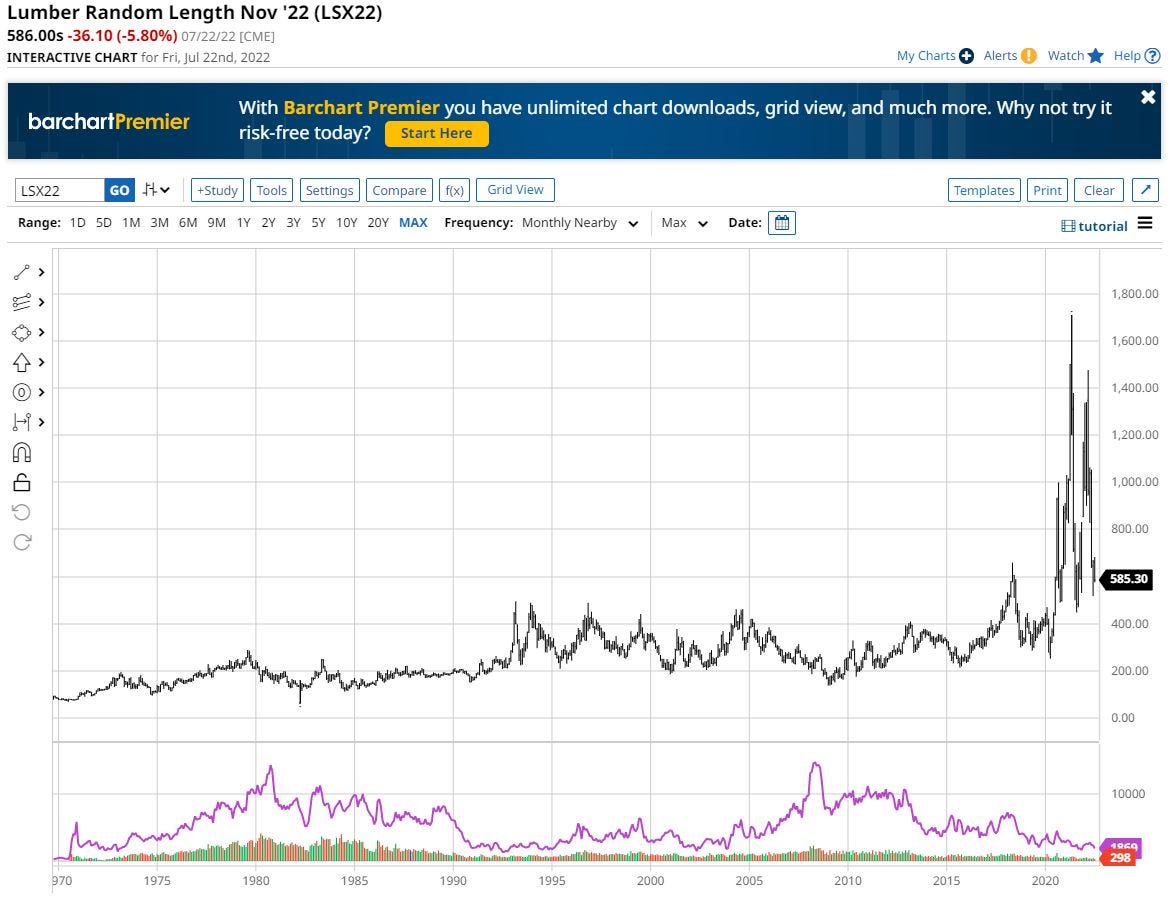
Prices become more volatile starting early 1993, and then they seem to have entered a new phase of higher volatility starting in 2020, before the presidential election. The implementation of a new “Timber Regulations” regime in Canada in 1993 might have something to do with it. (Canada has been an important supplier of timber to the United States.) Meanwhile, it really does look like the advent of coronavirus in 2020 put strains on lumber markets.
Let’s look at “West Texas Intermediate” oil futures over the last two years:
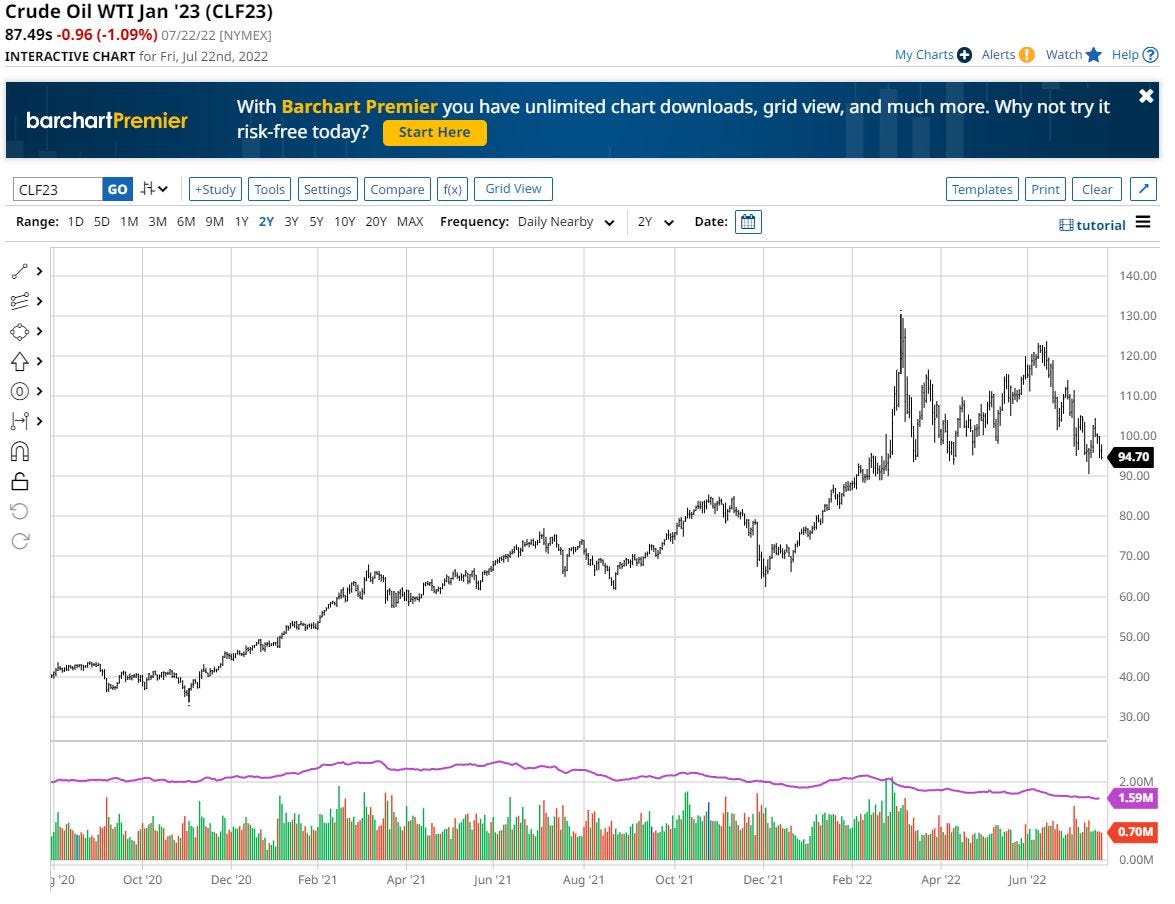
We definitely see a peak in early March, just after Russia invaded Ukraine, but prices have since moderated somewhat. What do we see going back to 1983?:
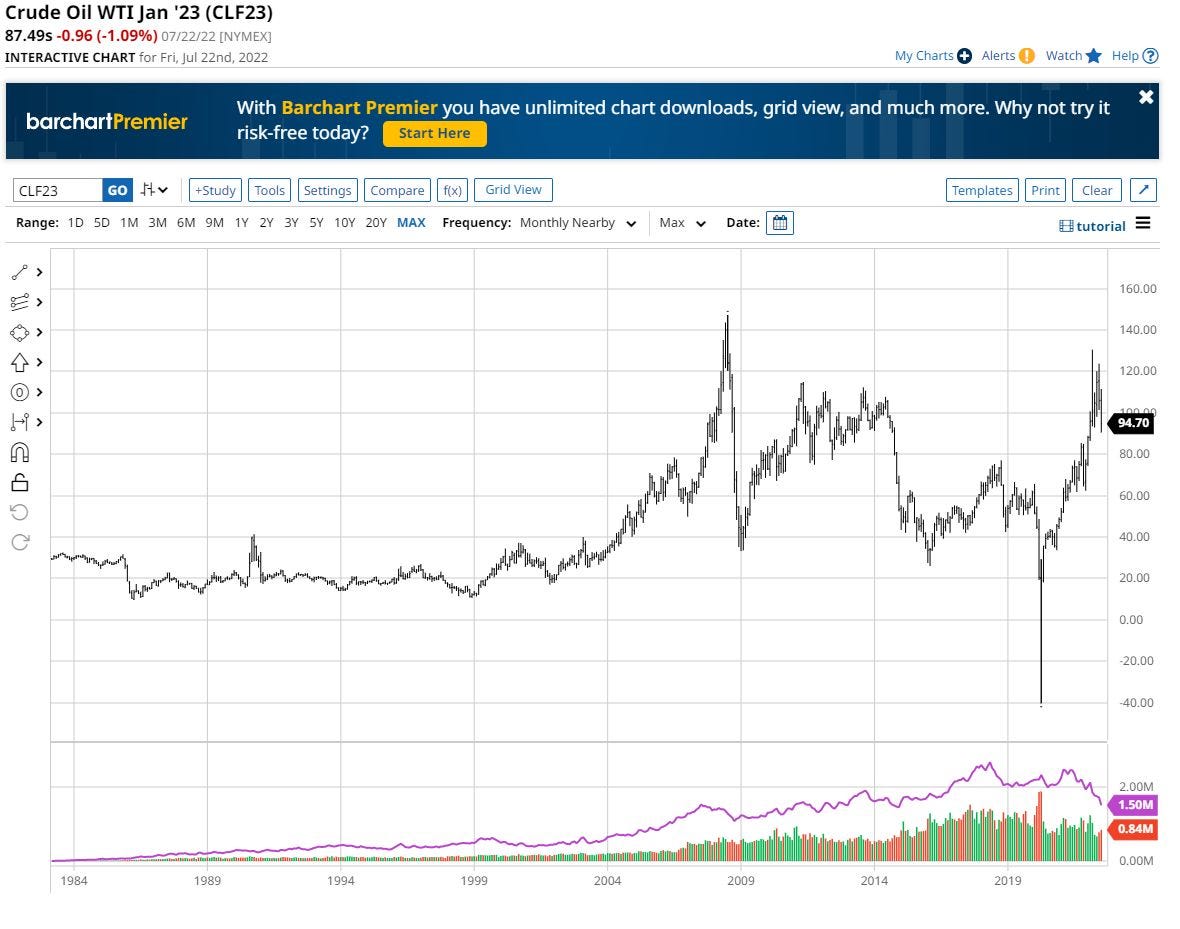
The Bush-era increase in 2007/2008 is obvious, and the crash in prices induced by the “Great Recession” in 2008/2009 is more striking. The action in late 2014 is interesting. What explains it? The invasion of Crimea and the Donbas region? The plunge in prices in March/April 2020 induced by the coronavirus lockdowns and hysteria is also obvious.
Going back to late 1990, one can see a spike that preceded the 1991 Gulf War. And note how prices fell precipitously at the end of 1985. I will have to think about that. One of the usual suspects might be the “Plaza Accords,” an agreement among the central banks of the United States, Britain, France, Germany and Japan to engineer a devaluation of the dollar. How the pieces fit together is not obvious—not (yet) to me, anyway.
Finally, let’s look at natural gas:
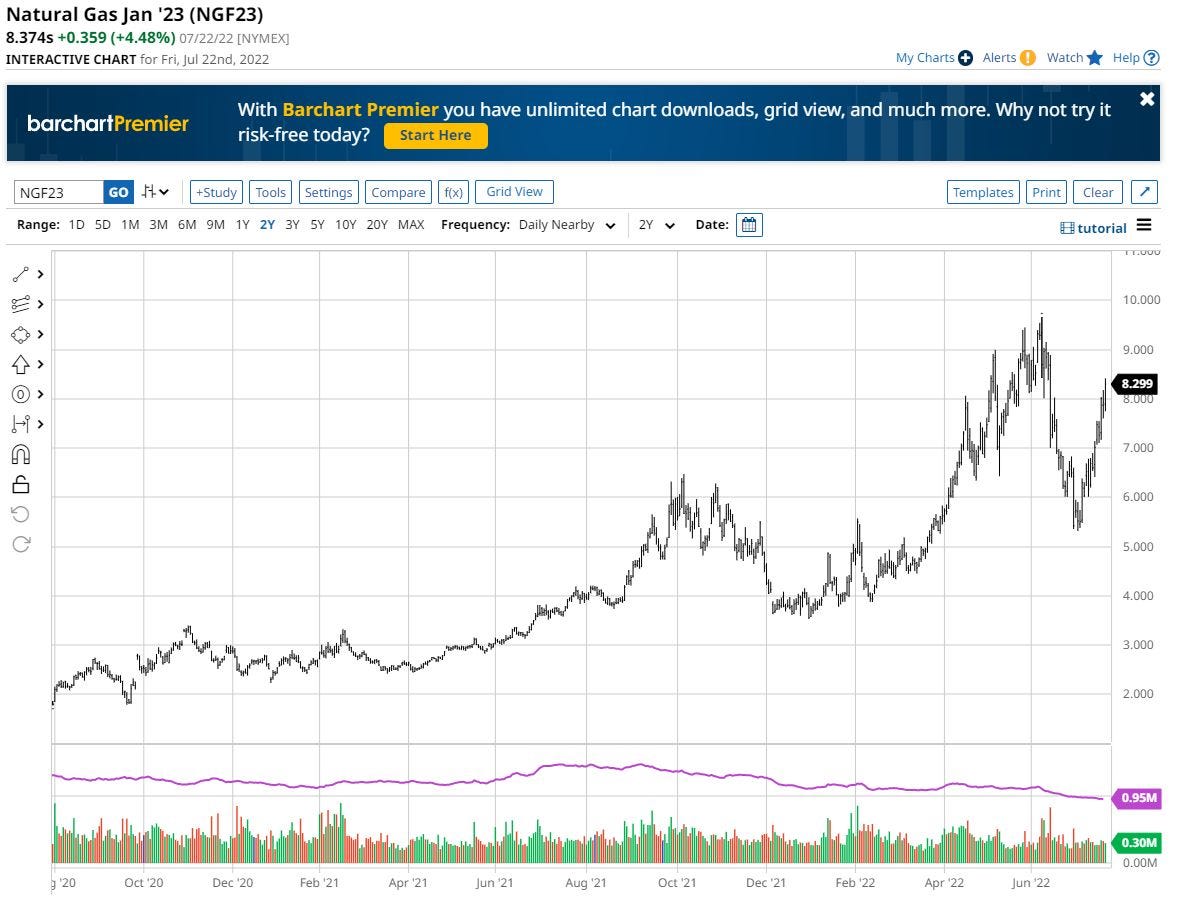
There has been much volatility that preceded the war in Ukraine, but one can’t deny that has been much action through the spring and even over the month of July alone. But lets look back all the way to 1990:
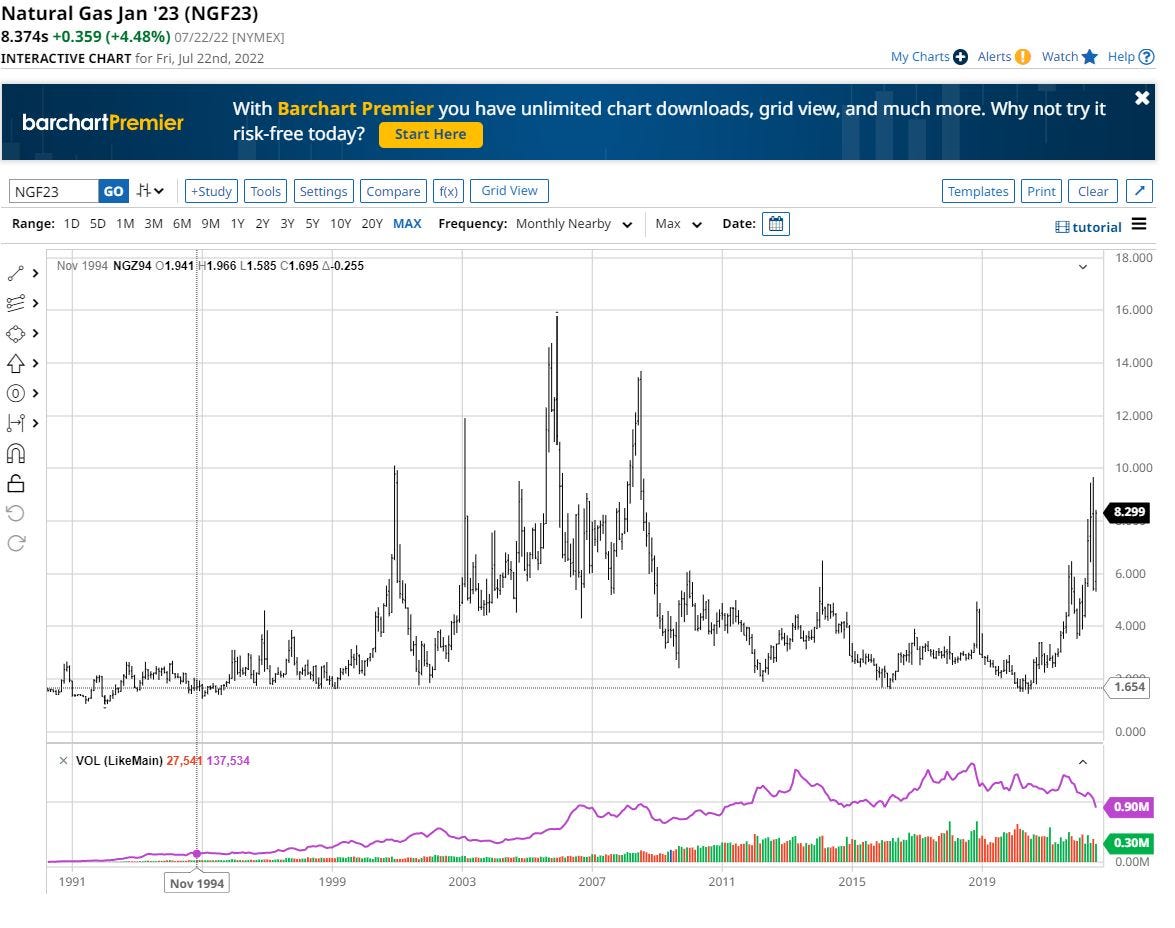
Futures markets in the United States for natural gas only became prominent in the late 1990’s. The physical infrastructure to support the globalization of oil markets will have been in place for many more decades. The infrastructure to support the globalizing of gas markets has only been coming into place over the last decade or so. But, in the United States, networks of pipelines and other facilities were in place by the late 1990’s. It was that infrastructure that helped motivate the deregulation of regional wholesale electricity markets. More natural gas. More scope for gas-fired “peaking units” that generators would fire up to meet peaks in demands.
The prospect of making big money on peaks attracted a lot of interest. That was the stuff of the Enron fiasco. Indeed, note the spike in gas prices at the end of 2000. That was the first manifestation in gas markets of growing pains in wholesale electricity markets.
Those markets became more volatile going forward, but it hard not to suggest that the fracking revolution put and end to that. Even so, starting in late 2021, well before the hostilities in Ukraine started, prices have started to move again. So we see evidence in the oil and gas futures markets of the efforts of the Biden Administration to “end fossil fuels”?
What to make of all of this? Wheat markets seem to have settled down, but energy markets remain in flux. Lumber markets seem to have moderated, but the coronavirus phenomenon does appear to have been an important influence on it. Now might be a good time to build. Everyone is going to get their bread and noodles, but winter heating remains a pressing issue.
Thanks for the analysis, quite interesting. The next period of stagflation ought to be interesting. Perhaps some return to stability as the marginal firms disappear. Won't be pretty.