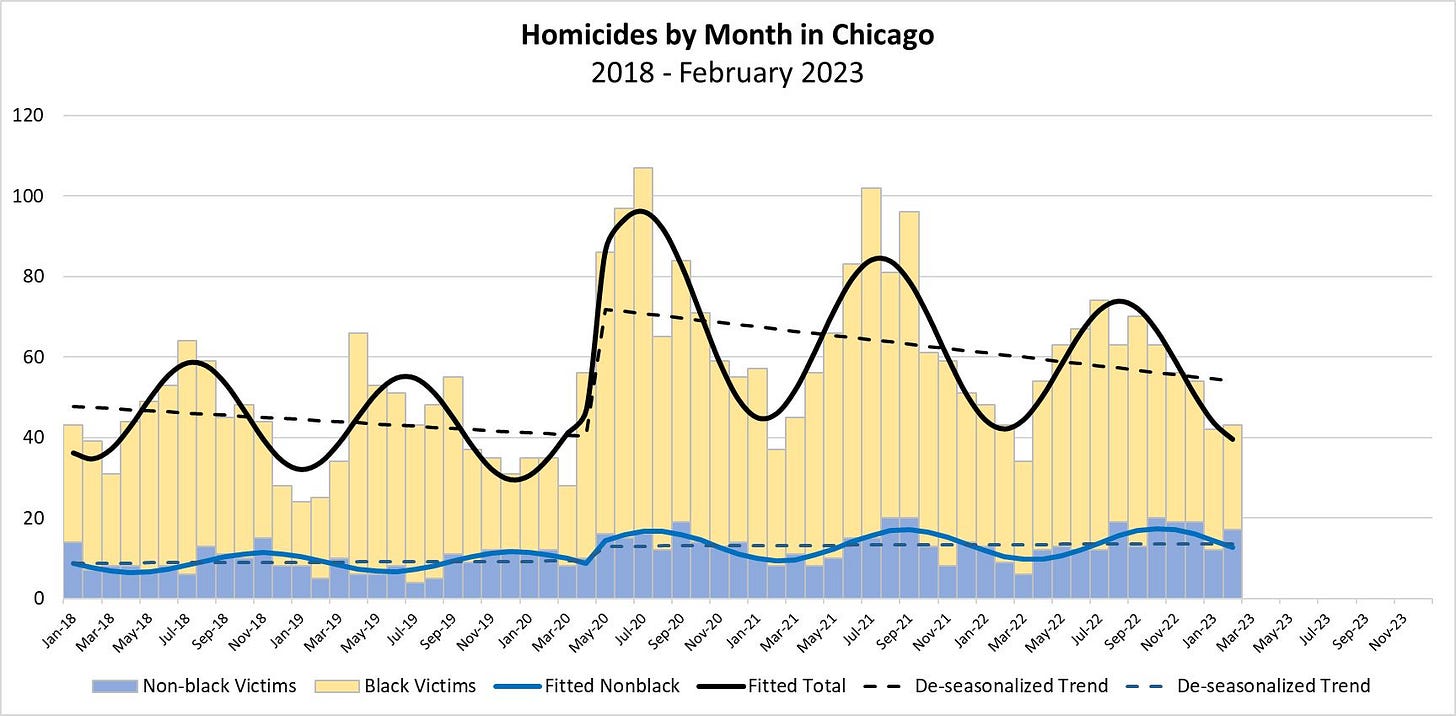
Homicides in Chicago, 2018 – February 2023
The total volume of homicides has been declining in the post-George Floyd era, but the volume of non-black homicide victims has remained elevated and shows no indication of declining.
This graph updates results I posted last summer.
The Chicago Sun Times has been documenting homicides in Chicago from January 2018 forward.
The black line in the graph indicates a fitted regression line. The waviness of the line reflects the obvious seasonality of homicides: Both before and after the George Floyd business in Minneapolis in May 2020, the total volume of homicides has peaked in the warmest months and receded in the colder months.
The dashed black line indicates the underlying trend. The rate of homicides pre-George Floyd had the appearance of declining by 3.3 per year, but that result is not statistically distinguishable from zero. Meanwhile, one can see the obvious jump in monthly homicides post-George Floyd, but the rate has the appearance of declining by 6.5 per year, and that rate of decline is statistically significant.
I generate the black line by fitting a “damped sine wave” and linear trend both pre-George Floyd and post-George Floyd.
I generate the blue line by fitting a damped sine wave and linear trend to the volume of homicides involving non-black victims.
Fitting a curve amounts to a purely mechanical exercise. It itself says nothing about the complex phenomena that generate seasonality in homicides or the obvious jump in the volume of homicides post-George Floyd. But, the exercise does identify robust patterns, and those patterns do suggest ideas about what is going on. Speaking more technically: The regression line amounts to a “reduced form” model of very complex phenomenon. A plausible “structural model” of that phenomenon would amount to a system of equations, not a single, reduced form equation. That system would say something about where all of the candidates for homicide come from, and it would further say something about where all the perpetrators come from. It would accommodate the prospect that many people may be both candidates and perpetrators. The system of equations would say something about the processes that generate encounters between prospective victims and perpetrators.
Suffice to say, there is a lot going on, and one can easily come up with lots of questions. Like, how is it that a community can generate a persistently higher or lower level of homicides? Homicide victims, of course, disappear from the scene, so they don’t stick around to attract negative attention going forward. That is an important feature of the dynamics of the system. But, new people enter the scene; there is some volume of cohort replacement. Somehow these new people get wrapped up in the apparent cycle of violence… unless and until, somehow, the volume of homicides diminishes.
The facts that the combination of a damped sine wave and linear trend fits these data well does suggest something: the volume of homicides post-George Floyd really is slowly decaying, although one might guess that it might not degenerate to near zero but settle on something that looks like the pre-George Floyd average of about 40 homicides a month.
What to get from this? I will suggest six sets of discrete points:
(1) The George Floyd effect is obvious.
(2) That said, the volume of homicides is declining, and one can only guess that they might converge on a pre-George Floyd level of about 40-per-month. That still amounts to about 480 homicides a year, but that’s notably better than the current rate of about 54 per month/648 per year.
(3) The pronounced seasonality of homicides is consistent with something that has been going on since about 1885:
a. Homicide in the big cities has been concentrated in the black community.
b. Those homicides exhibit seasonality, because they are concentrated in social networks. They occur when people are most likely to get together and generate encounters amenable to fraught exchanges. Such exchanges are most likely to occur during the warmer months when everyone gets outside and socializes.
I discussed the history of this phenomenon here:
(4) Homicides among non-blacks also exhibited seasonality pre-George Floyd. Such homicides would peak in November … around the Thanksgiving dinner table?
(5) But, note, the phase shift in the volume of homicides of non-blacks post-George Floyd. Post-George Floyd ,such homicides have tended to peak in the warmer months.
(6) The volume of homicides involving non-black victims has not yet exhibited any hint of decline post-George Floyd. The average monthly level of 8.8 homicides a month has risen to 12.4 homicides a month. This result is statistically significant.
And, there it is. Homicides in Chicago remain elevated compared to pre-George Floyd levels, but they have been declining. A question remains, however, about whether the volume of homicides will increase now that the state of Illinois has implemented “bail reform” as of January 2023. (Here is a pro-bail reform citation.) So far, so good.
Even so, note that the killings of non-blacks have been elevated, remain elevated, and show no indication of returning to pre-George Floyd levels. Why is that?


