

Crime in the Time of Tolerance
A Tale of Three Cities in Two Acts

There are eight images/graphs in this essay. It might be easier to view everything online rather than in an email.
The main point of this essay (the First Act) and a following essay (the Second Act) is that the principal way of reducing violent crime is to get bad guys off the street. Further, Old School policing and enforcement does matter in getting bad guys off the street. That might sound obvious, but the defund-the-police crowd might argue that alternatives to enforcement (“restorative justice”) would yield better results. But, I will argue that:
There really is evidence that Old School “enforcement” does gets bad guys off the street and out of circulation; getting bad guys off the street reduces crime. That said, …
Throwing money at enforcement does not necessarily reduce crime.
Neither does having good laws on the books necessarily reduce crime. Rather, directing resources into serious enforcement reduces crime. Even so, …
Crime may yet settle into a lower-crime equilibrium (if not a low-crime equilibrium) even under a low-enforcement regime, but it can take time. Finally, one can speculate about why crime might moderate under a low-enforcement regime. Again the “restorative justice” crowd would credit restorative justice, but maybe …
The rate of attrition (by way of bad guys shooting bad guys or Old School vigilantism) may prove high enough to reduce the concentration of bad guys on the street, in which case crime moderates—over time. There might be a story in here about private enforcement or private vendettas filling the void left by the retreat of public enforcement.
So, we all like stories of redemption. We all like stories of bad guys coming to Jesus (metaphorically or literally) and thereby graduating from the status of irredeemable, antisocial wretches to redeemable, prosocial wretches. That’s what “restorative justice” is about. But, it is not obvious that redemption is a statistically discernible phenomenon when it comes to crime. Rather, the business of getting bad guys off the street may be the principal means of driving crime down. Ways to get them off the street would include (1) Old School enforcement and incarceration, (2) bad guys taking each other out of circulation, (3) vigilantism—that is, the substitution of public enforcement with private enforcement, and (4) people in the most restive communities having fewer kids thereby allowing the cohort of bad guys to mellow into old age without being replaced. How to get a grip in the data about these processes may be tricky, but from publicly-available data we can get a few vivid clues, if not definitive answers, about what is going.
* * *
One of those cities in this tale of three cities—or this tale of studied non-policing—is Los Angeles. Los Angeles, of course, has been the focus of much news this last week; well-funded ANTIFA-types have endeavored to disrupt the activities of federal immigration officials. We know from the DOGE experience that the federal government has channeled $billions and $billions into the NGO/ANTIFA Borg-o-sphere these last several years. The Borg are mobilizing.
As I understand it, things started kicking off outside a Home Depot in the city of Paramount. Paramount comprises but one of a large cluster of municipalities that occupy the center of the LA Basin. It is situated just east of Compton. Migrants often concentrate around the big box hardware stores (Home Depot, Lowes) looking for work. It’s a well-known phenomenon. Immigration enforcement personnel swept in to sweep up illegal immigrants.
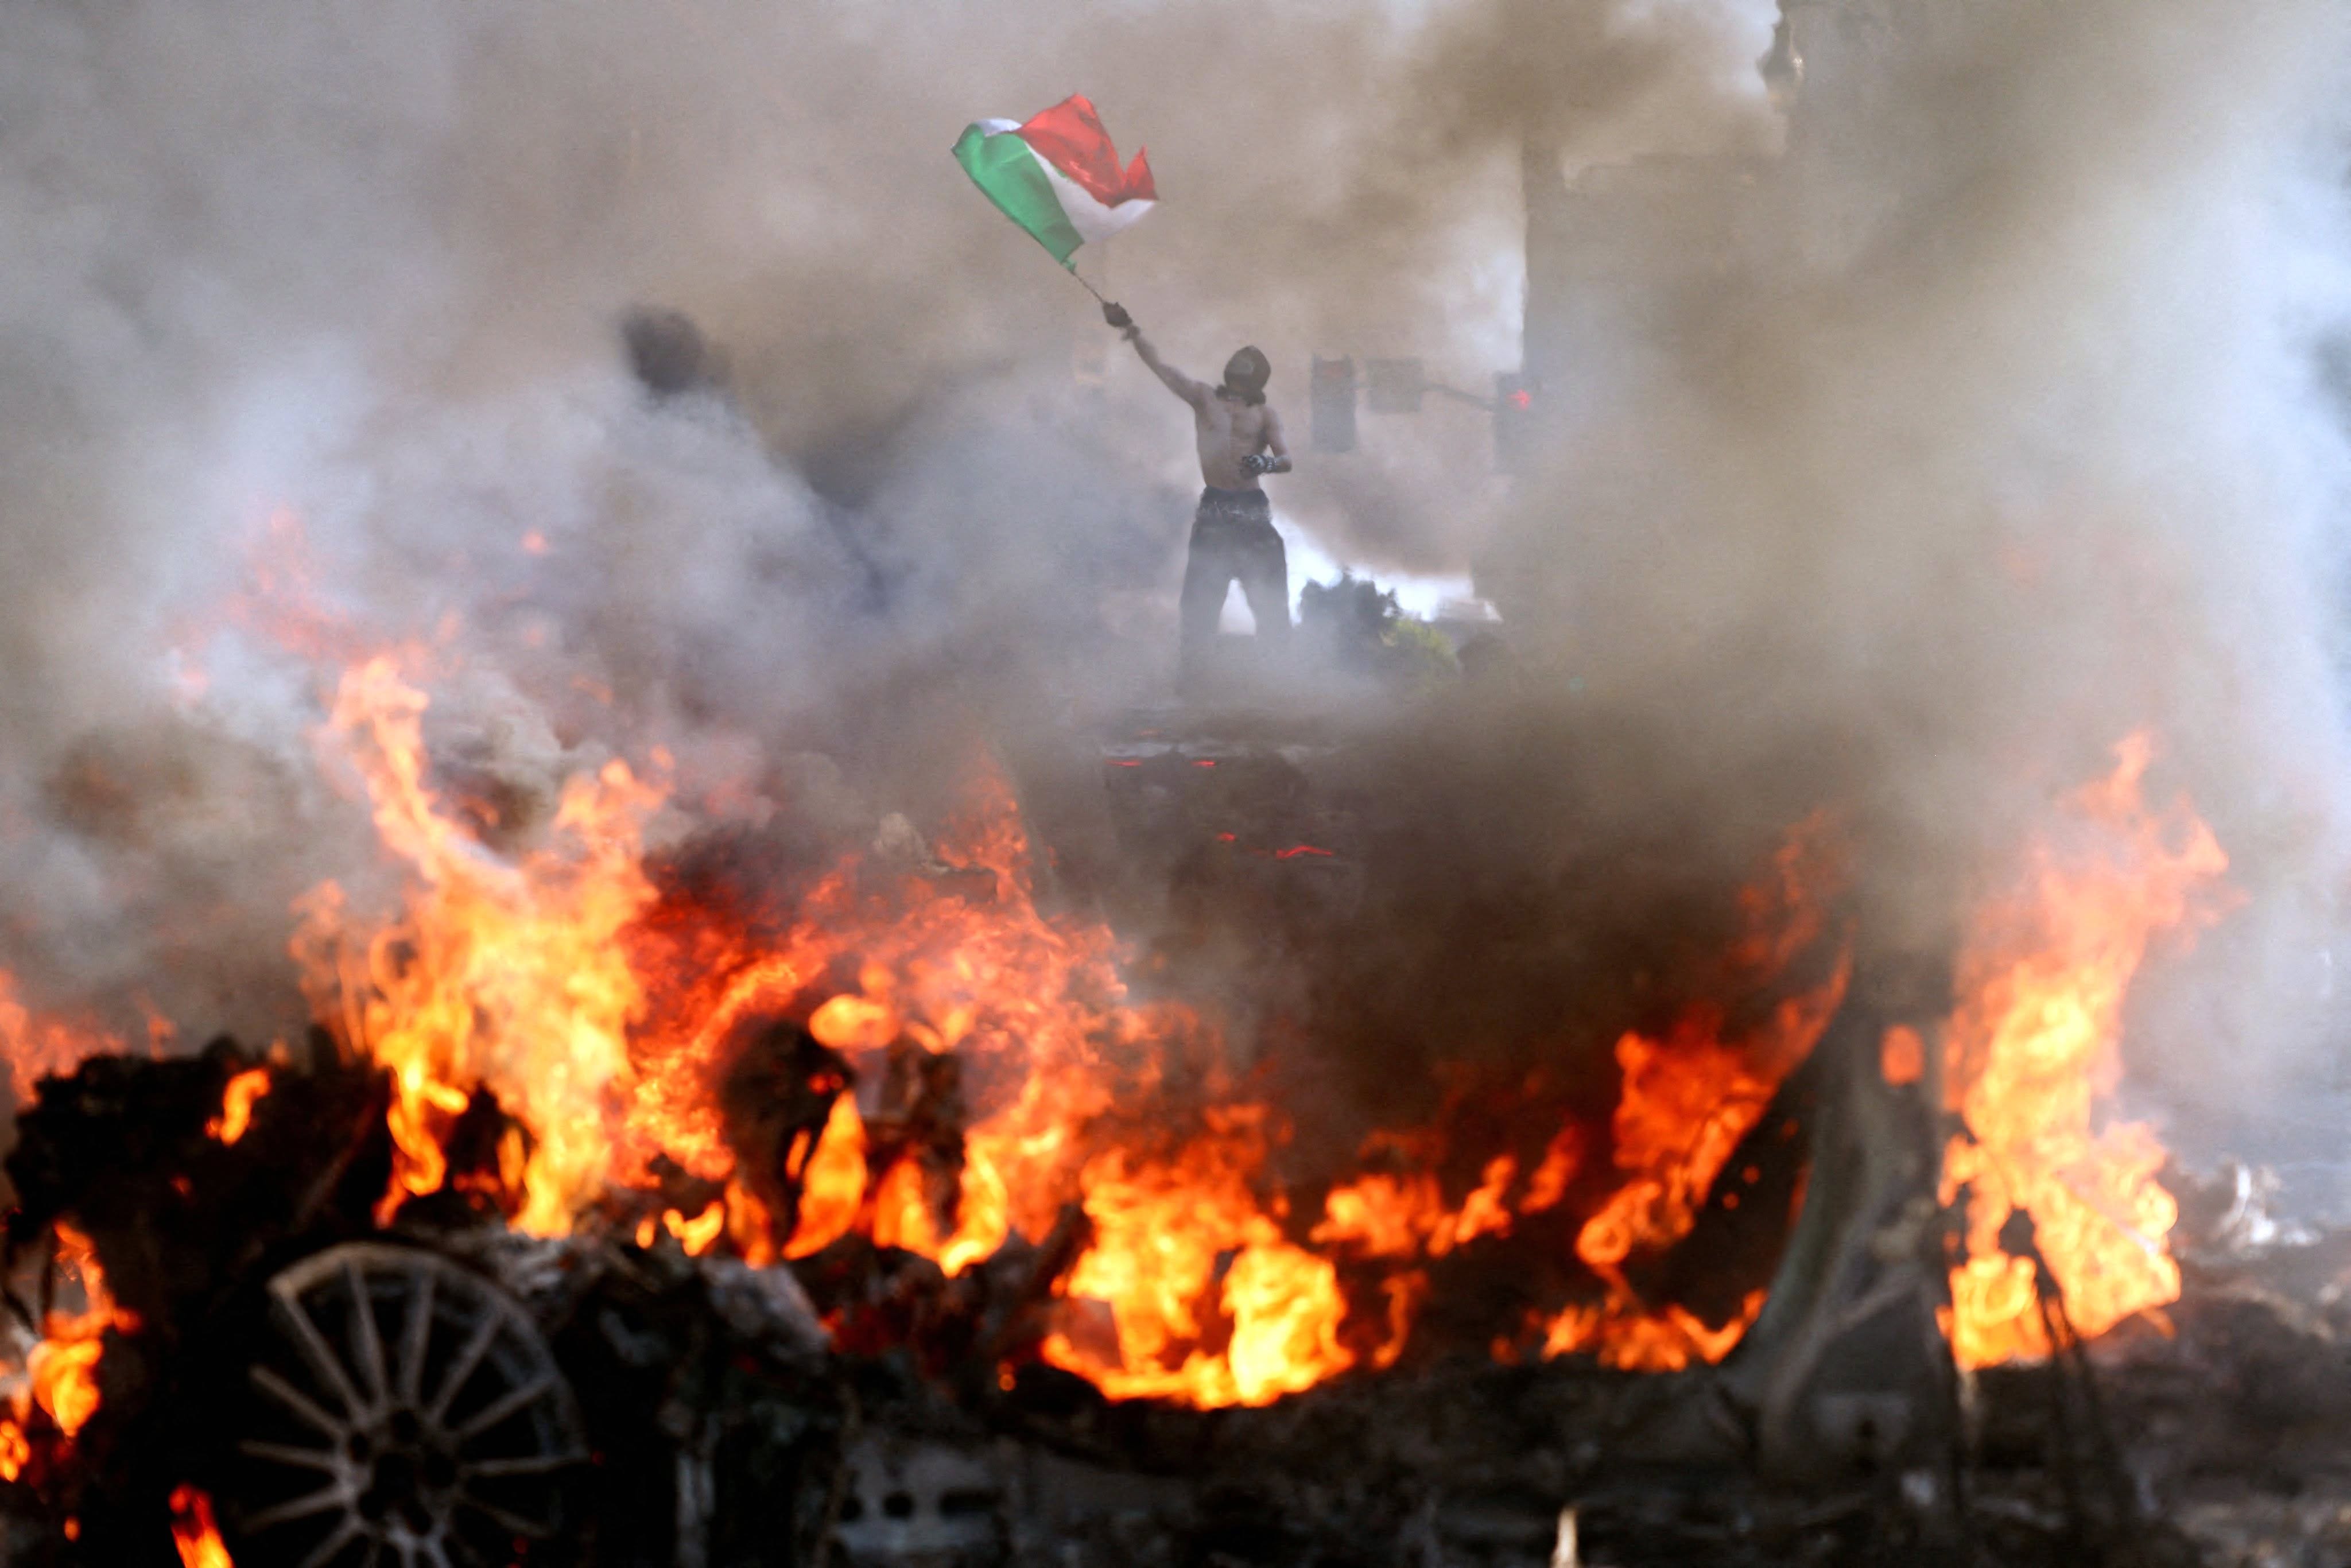
“Things,” of course, degenerated into a sequence of riots. The riots follow a familiar formula: a mix of looting, throwing stones at police vehicles, burning vehicles. An innovation is that the 2025 iteration of rioting involves a larger than usual display of Mexican flags as well as some volume of pro-Palestinian chanting. As in the immediate aftermath of the 2020 George Floyd experience, the establishment media passes off this round of rioting as some version of “mostly peaceful.”
There is some understanding that municipalities, both large and small, had rolled back day-to-day enforcement since the George Floyd experience of 2020. California is special in that it went out of its way to effectively decriminalize shoplifting. So, relaxed enforcement and more opportunity for easy and lucrative crime had led to more crime. But, that’s California. Is lax enforcement more of a nationwide phenomenon, or has it been concentrated in a small number of large, urban, Progressive bastions like LA, San Francisco, Chicago, Minneapolis, Philadelphia, Boston and Seattle? Has lax enforcement post-George Floyd proven to be more of a fad, or is it something that yet endures? Has lax enforcement broadly resulted in higher volumes of certain types of crime? Has it tossed certain communities into low-enforcement/high-crime equilibria, or has crime moderated over time such that we end up with low-enforcement/moderate-crime equilibria?
This essay is the first of two about living in the city over the course of regime changes—changes in policing regimes—and there is an understanding that the ramping up and throttling down of the volume and intensity of on-the-street policing has been swept up in broad, nation-wide currents. The early 1990’s, for example, featured an expansion across the states of the United States of “three-strikes” laws. Broadly, “three strikes” laws would impose higher prison sentences on felons convicted a third time for a felony. Surprisingly, it was California that led the way with one of the more serious laws:
The Three Strikes law significantly increases the prison sentences of persons convicted of felonies who have been previously convicted of a violent or serious felony, and limits the ability of these offenders to receive a punishment other than a prison sentence. Violent and serious felonies are specifically listed in state law. Violent offenses include murder, robbery of a residence in which a deadly or dangerous weapon is used, rape and other sex offenses; serious offenses include the same offenses defined as violent offenses, but also include other crimes such as burglary of a residence and assault with intent to commit a robbery or rape.
The Republican governor of California, Pete Wilson, signed bill AB 971 into law in early 1994, and right after that the volume of certain types of serious crime started to decline. High-enforcement seemed to have induced a low-crime equilibrium. But not at the flip of a switch. It took a few years.
I am going to explore certain crime data more seriously in the second essay, but here is a preview:
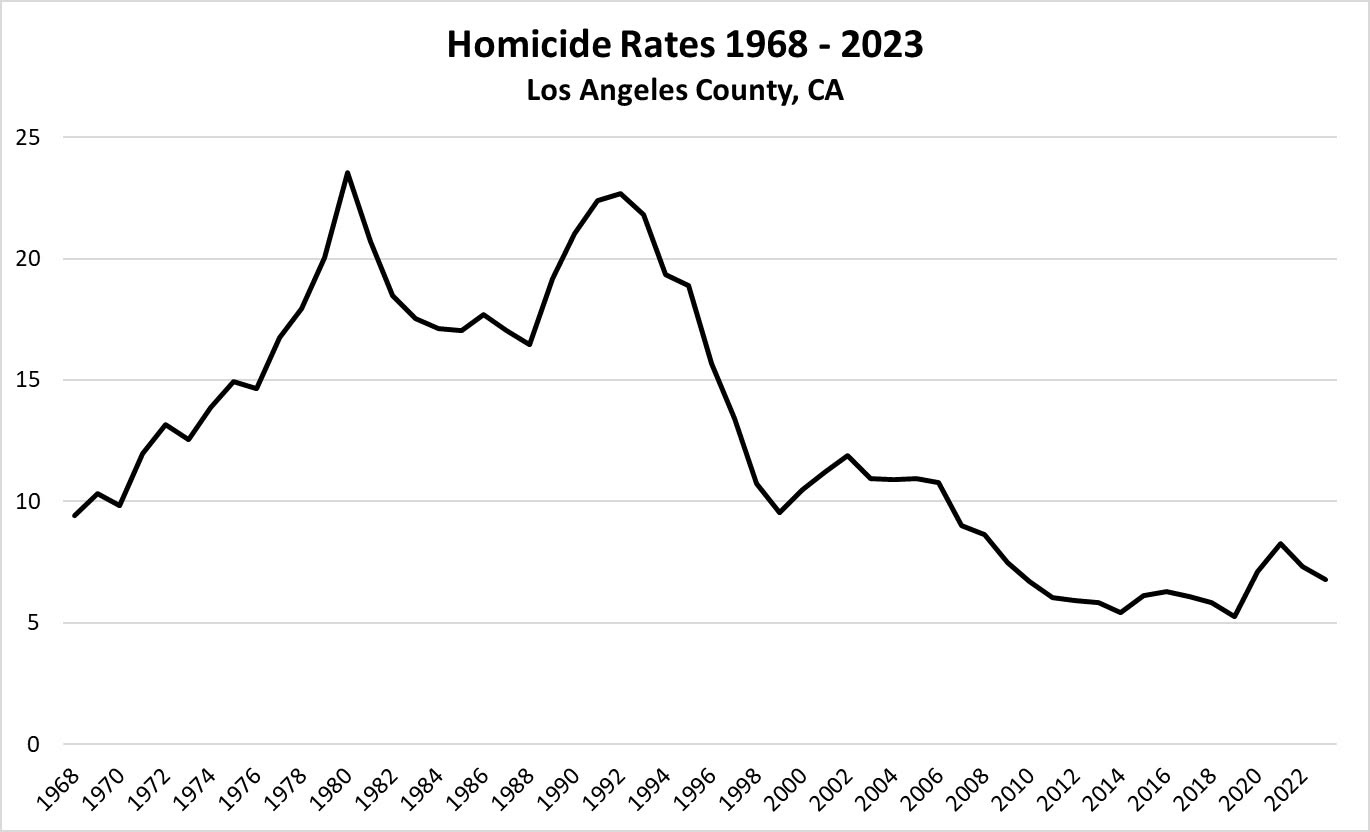
The “homicide rate” indicates the annual number of homicides per 100,000 residents in Los Angeles County. LA County encompasses 88 municipalities and itself broadly comprises what we think of when talk of “Los Angeles.” The city of Los Angeles covers much of LA County, but the county also includes such diverse cities as Long Beach, Santa Monica, Pasadena, Claremont and Malibu.
One can see that homicides had risen sharply through the 1970’s before moderating somewhat through the 1980’s. They rose sharply again with the advent of the “Crack Wars” in the late 1980’s, but rates declined sharply over the four years following the passage of California’s “three strikes law.” Homicide rates halved again from about 2006 through 2014. (Why? How?) The data do indicate a jump consistent with a “George Floyd effect” in 2020, but rates had not risen to pre-2009 levels.
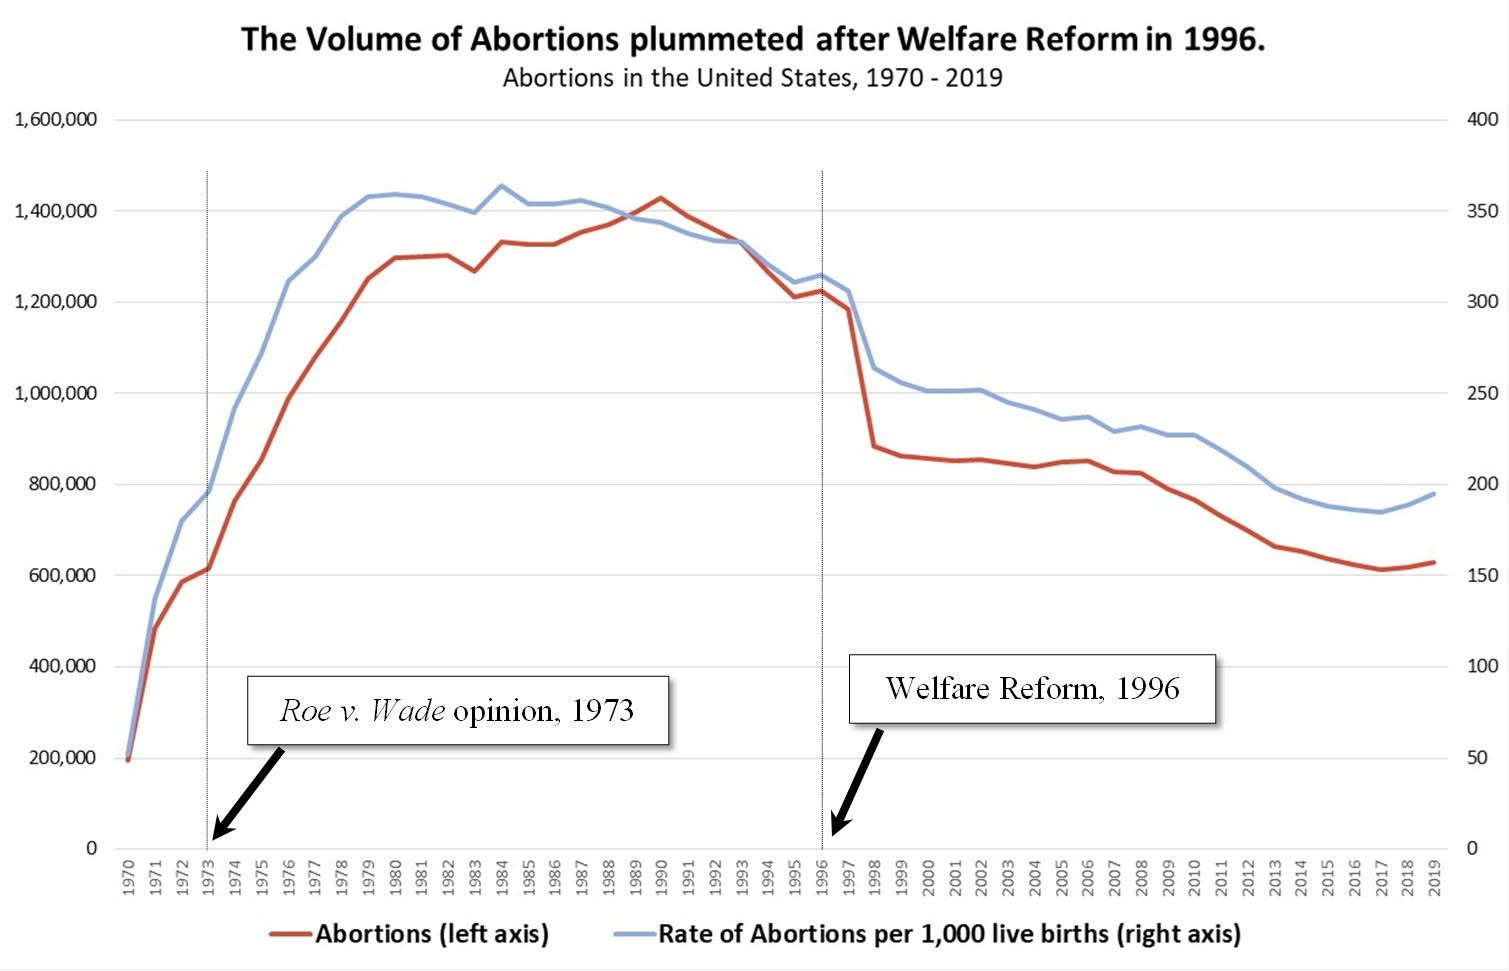
What accounts for these obvious, big shifts in homicide rates? Some observers latch on to the observation by one of the authors of Freakonomics that the big decline in the early 1990’s coincided a 20-or-so-year lag after the Supreme Court opinion in Roe v. Wade (1973). The suggestion, heartily advanced by abortion proponents, was that the cohort of young people entering adulthood by 1995 had been much diminished. The real point: It included a smaller number and concentration of “unwanted” children. Fewer unwanted children resulted in less violent crime 20-some years down the road.
Others have put energy into discounting the robustness of that explanation, and I am not going to give it attention beyond merely suggesting that people do not have many robust ideas about how to explain the ups and downs of violent crime. Indeed, I would even be devilishly tempted to suggest that the decline in crime in the 2000’s (2006-2014) was driven by the apparent decline in births (not abortions) that seems to have been driven by the 1996 “welfare reform.” There had been much debate in 1996 about whether including “work requirements” in welfare eligibility would induce either an increase or decrease in abortions. It ended up inducing a sharp and immediate decrease … because candidate welfare supplicants decided en masse not to have kids in the first place?
All I am going to do in this essay and the next essay is suggest that there are important clues that themselves suggest that enforcement matters. Laws may not matter per se. California still maintains its three strikes law, but, if the authorities choose to ignore the law, then they ignore the law. Having laws on the books is not a sufficient condition, evidently, for following effective enforcement.
I will argue that actual enforcement probably does explain some non-trivial share of the up-and-down, but the matter of how to measure enforcement is not entirely obvious. Are there broadly available data that illuminate the intensity of enforcement? And, I don’t mean data on “outputs” like numbers of arrests or “stop-and-frisk” encounters, because those numbers could be either high or low under either a high or low-enforcement regime. One can imagine, for example, living under a high-enforcement regime under which actual enforcement activity is very low because everyone knows that conspicuously making trouble will invite effective enforcement. There is likely a lot of “endogeneity” in the observable data.
What about “inputs” like spending on enforcement? One might expect that data on spending on enforcement would suggest something about the intensity of enforcement, but spending on enforcement these last thirty years may be much like spending on education: We spend more and more per student, but performance has remained stagnant or has declined. Burgeoning public school budgets look more and more like employment programs for bloated school administrations. Much the same could be said for other publicly-provided services: Are they more about shoveling money and jobs to favored constituencies than about providing actual services?
On to the main body of this essay. I am not going to actually talk about violent crime, but I am going to suggest that data on traffic fatalities reveals a post-George Floyd relaxation of police enforcement (with respect to reckless driving, anyway), and I will further suggest that (1) this relaxation of enforcement spanned much of the country and (2) reflects broader relaxation of all police enforcement. Now, that makes for quite a bundle of assumptions and guesses, but here goes:
Some time ago I observed that someone had posted a graph about traffic fatalities among blacks. Post-George Floyd, the number of fatalities jumped up sharply. The larger suggestion might have been that police forces around the country had, on average, throttled back the policing of reckless driving, at least with respect to black drivers. There was an assumption that Driving-While-Black was a real phenomenon with respect to traffic enforcement. (I don’t think it is—hold that thought.) Further, Driving-While-Black became less subject to policing. Here’s an interesting graph I assembled using CDC data on fatalities by “Motor Vehicle Traffic.”
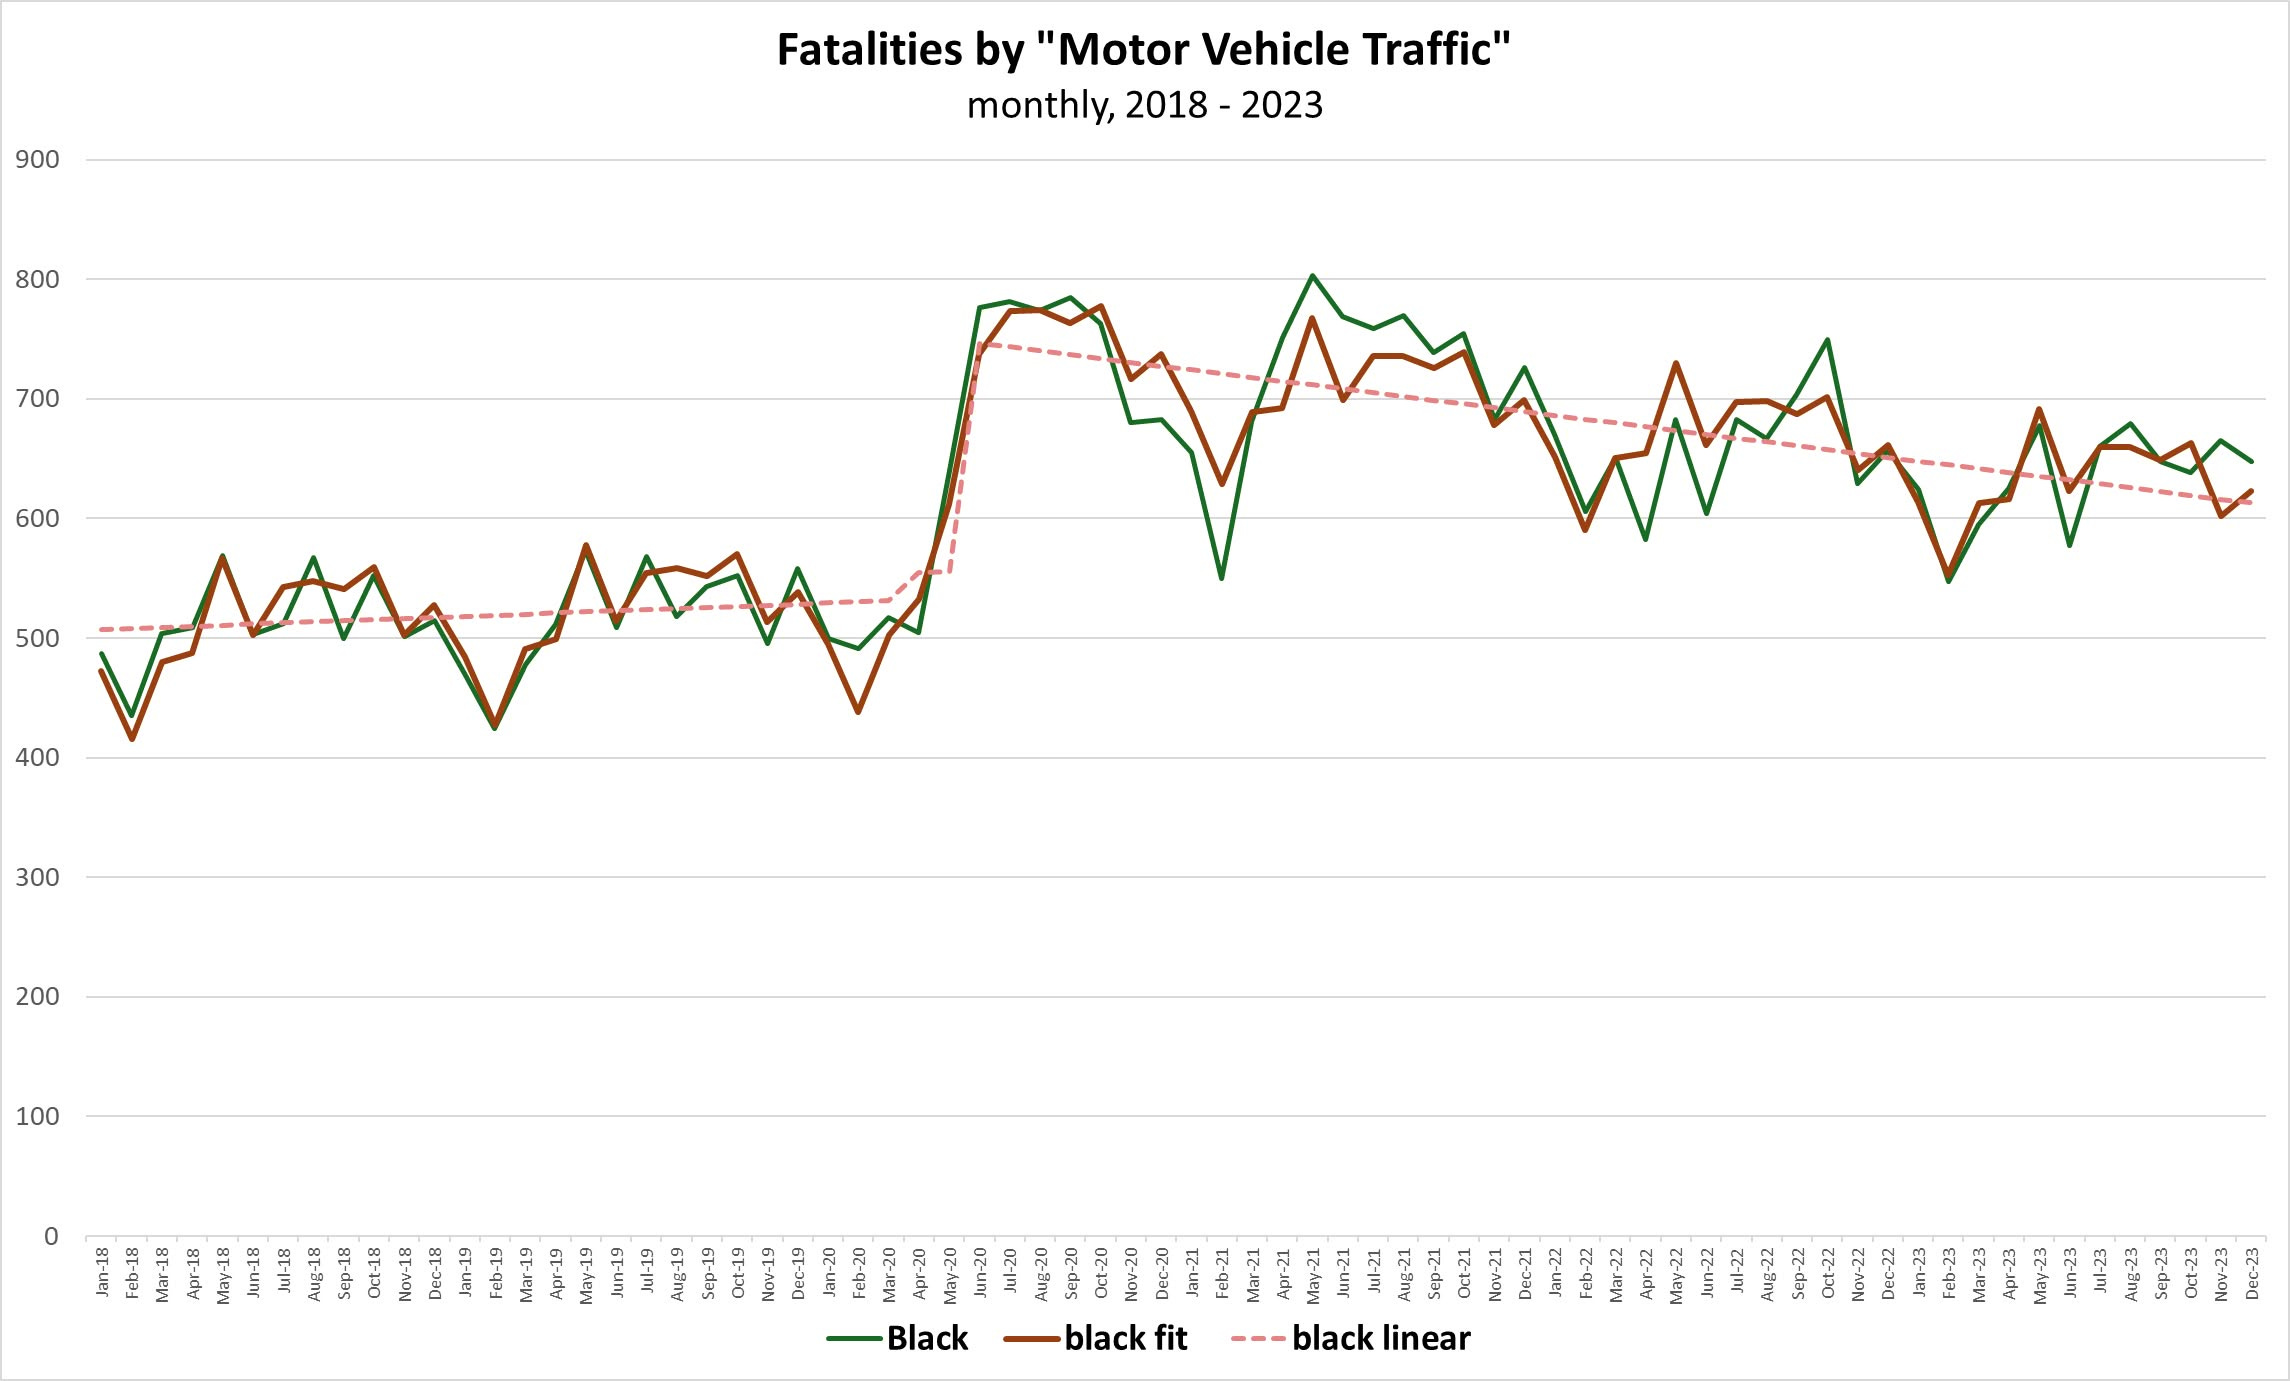
The green line reflects monthly traffic fatalities among blacks for the years 2018 – 2023. The red line is a regression line that I fit by imposing a pre-George Floyd linear trend, a COVID-era linear trend, and a post-George Floyd linear trend. I also imposed monthly dummy variables. The dashed line indicates the piece-wise linear trend.
What do we see? Traffic fatalities among blacks averaged a little over 500 per month pre-COVID and pre-George Floyd. They bumped up slightly post-COVID, but that result is not statistically robust. What is very robust is the post-George Floyd increase in traffic fatalities. They bumped up from about 550 per month to about 750 per month.
There is another robust effect: The volume of traffic fatalities declined by more than 3 per month on average post-George Floyd. That may not sound like a lot, but it amounts to decline of about 40 per year over the course of more than three years. By the end of 2023, that monthly trend declined by nearly 133 fatalities.
So, yes, fatalities did jump sharply post-George Floyd, but they have declined steadily in the post-George Floyd era. So, it does look like Driving-While-Black has attracted less police enforcement post-George Floyd, but total fatalities have yet declined appreciably. Have we settled into a low-enforcement/lower-fatality equilibrium?
Now, is it really feasible to implement racial profiling when it comes to traffic enforcement? Is Driving-While-Black a real phenomenon when it comes to police enforcement. I don’t think so. Consider this graph:
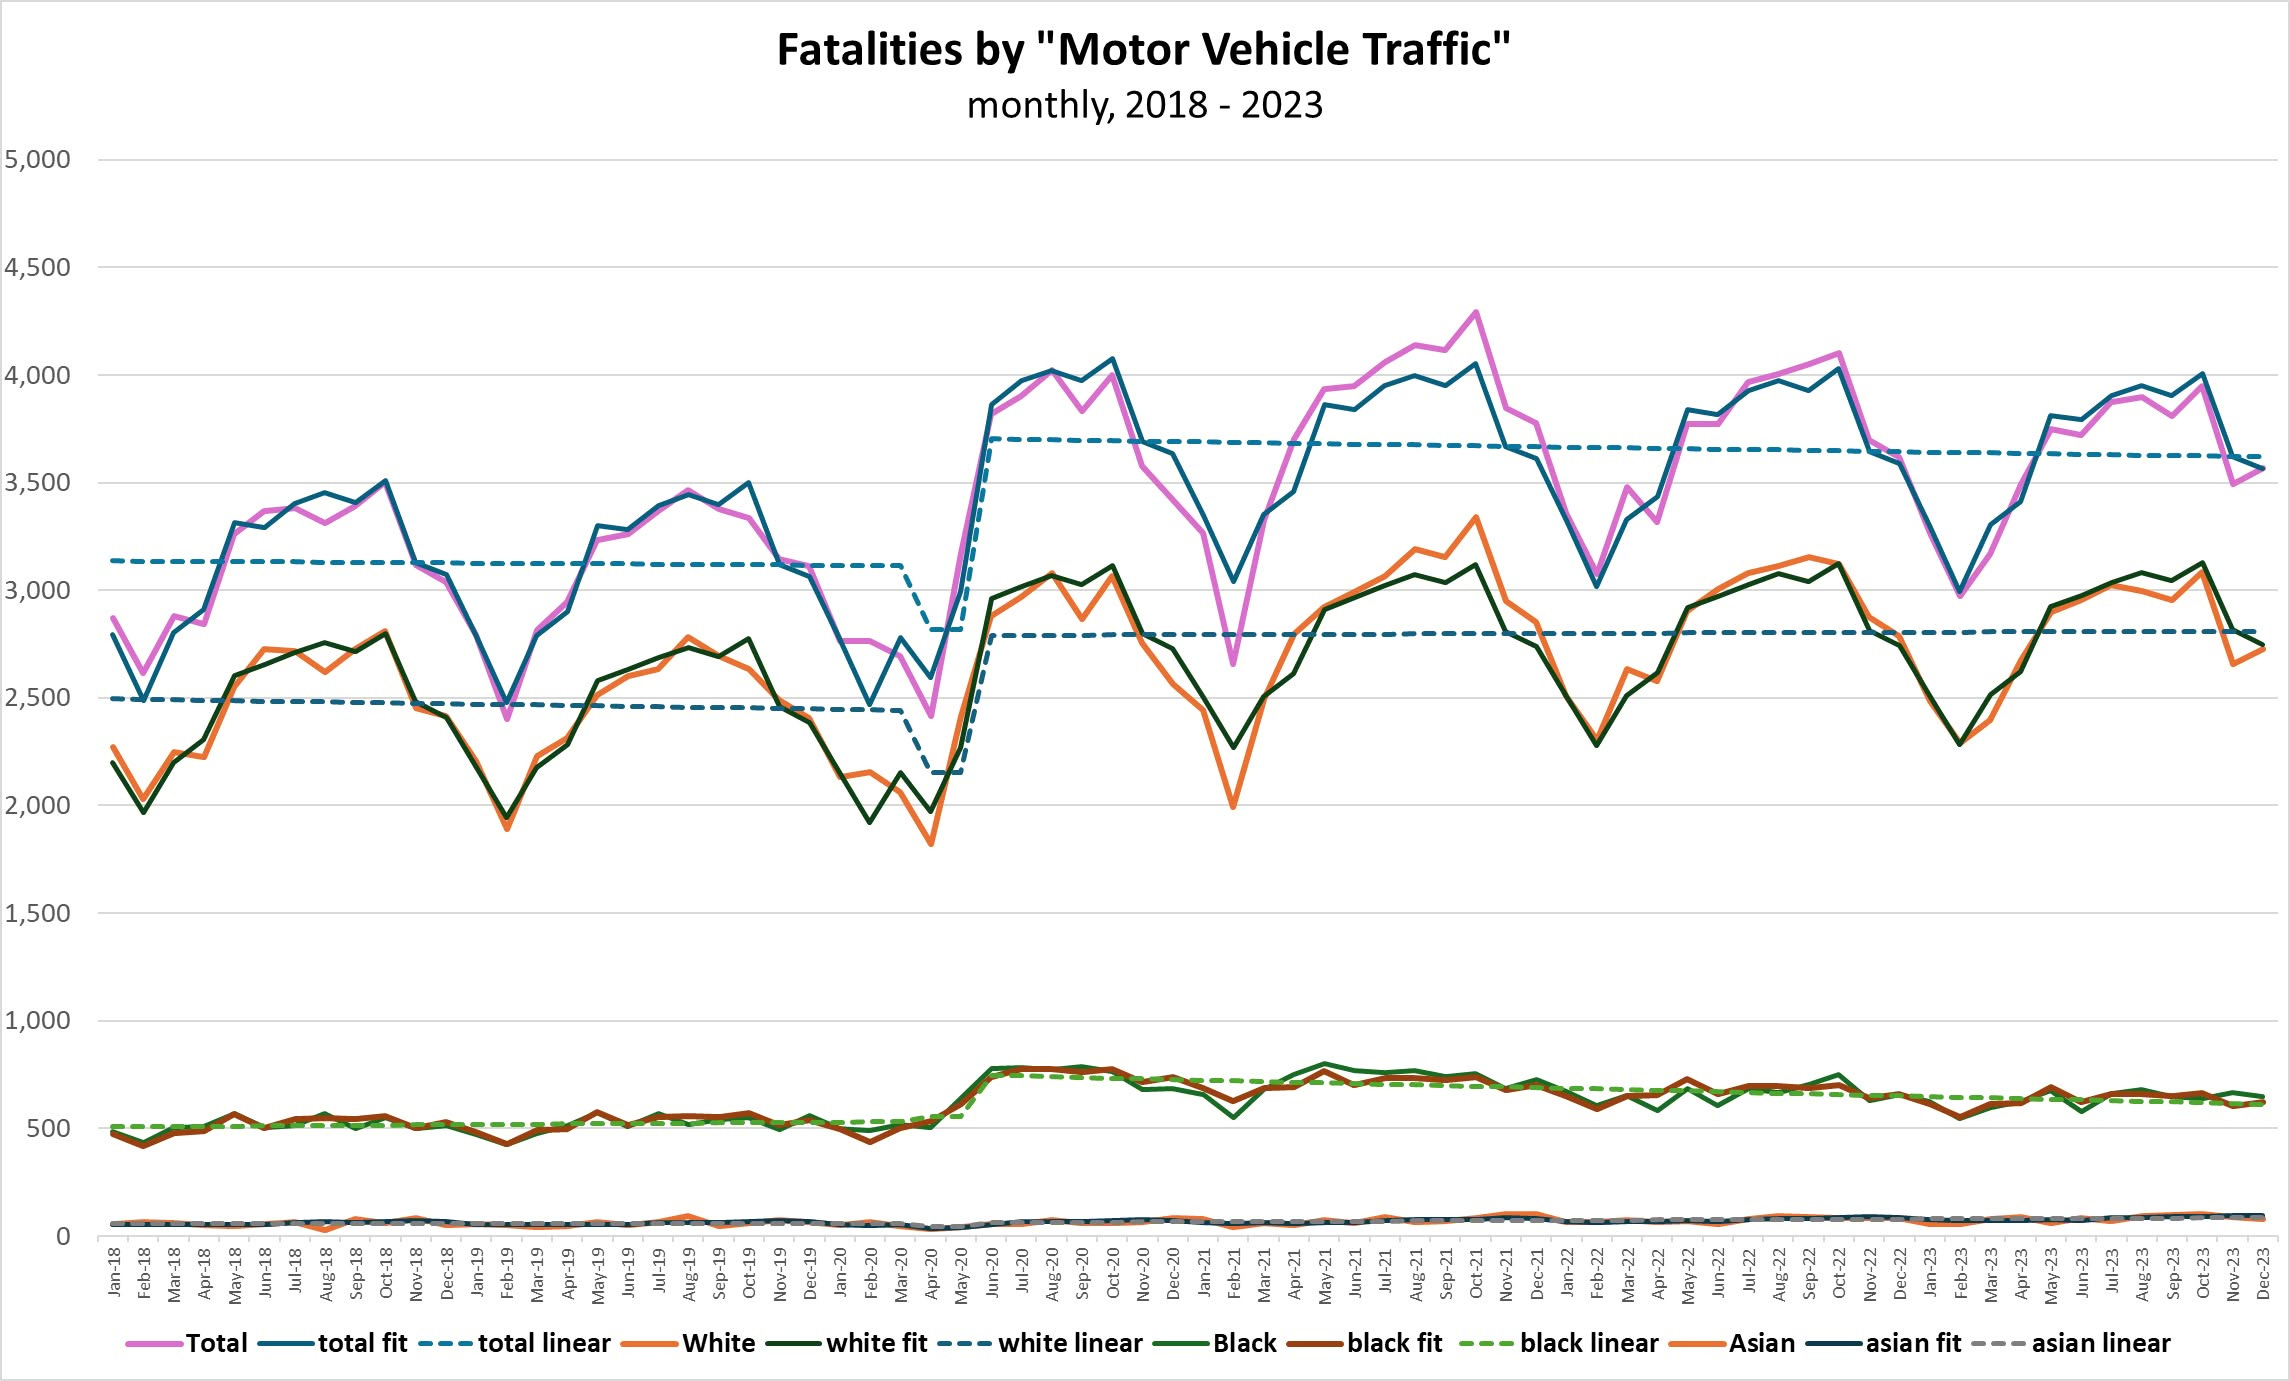
This graph indicates the CDC data by “race”: white, black, Asian, and Native American. The locus of points at the top indicate total traffic fatalities. For each of these five categories, I fit a regression line and indicate the underlying linear trends.
The linear trends make it easier to see the important effects, but note the seasonal pattern of traffic fatalities: Traffic fatalities are at their lowest in February and they peak in October. The COVID year (2020) is a little different in that fatalities were lowest that April (when everyone was stuck at home and not driving to work). But, fatalities increase in the summer and peak in the middle of autumn before declining through the colder months. The fatalities pick up again with “spring break” in March and April.
Fatalities among white people (which includes Hispanics) constitute the majority of fatalities. Fatalities among Asians and Native Americans are hardly discernible in this graph. But, let’s dig in. There are surprises.
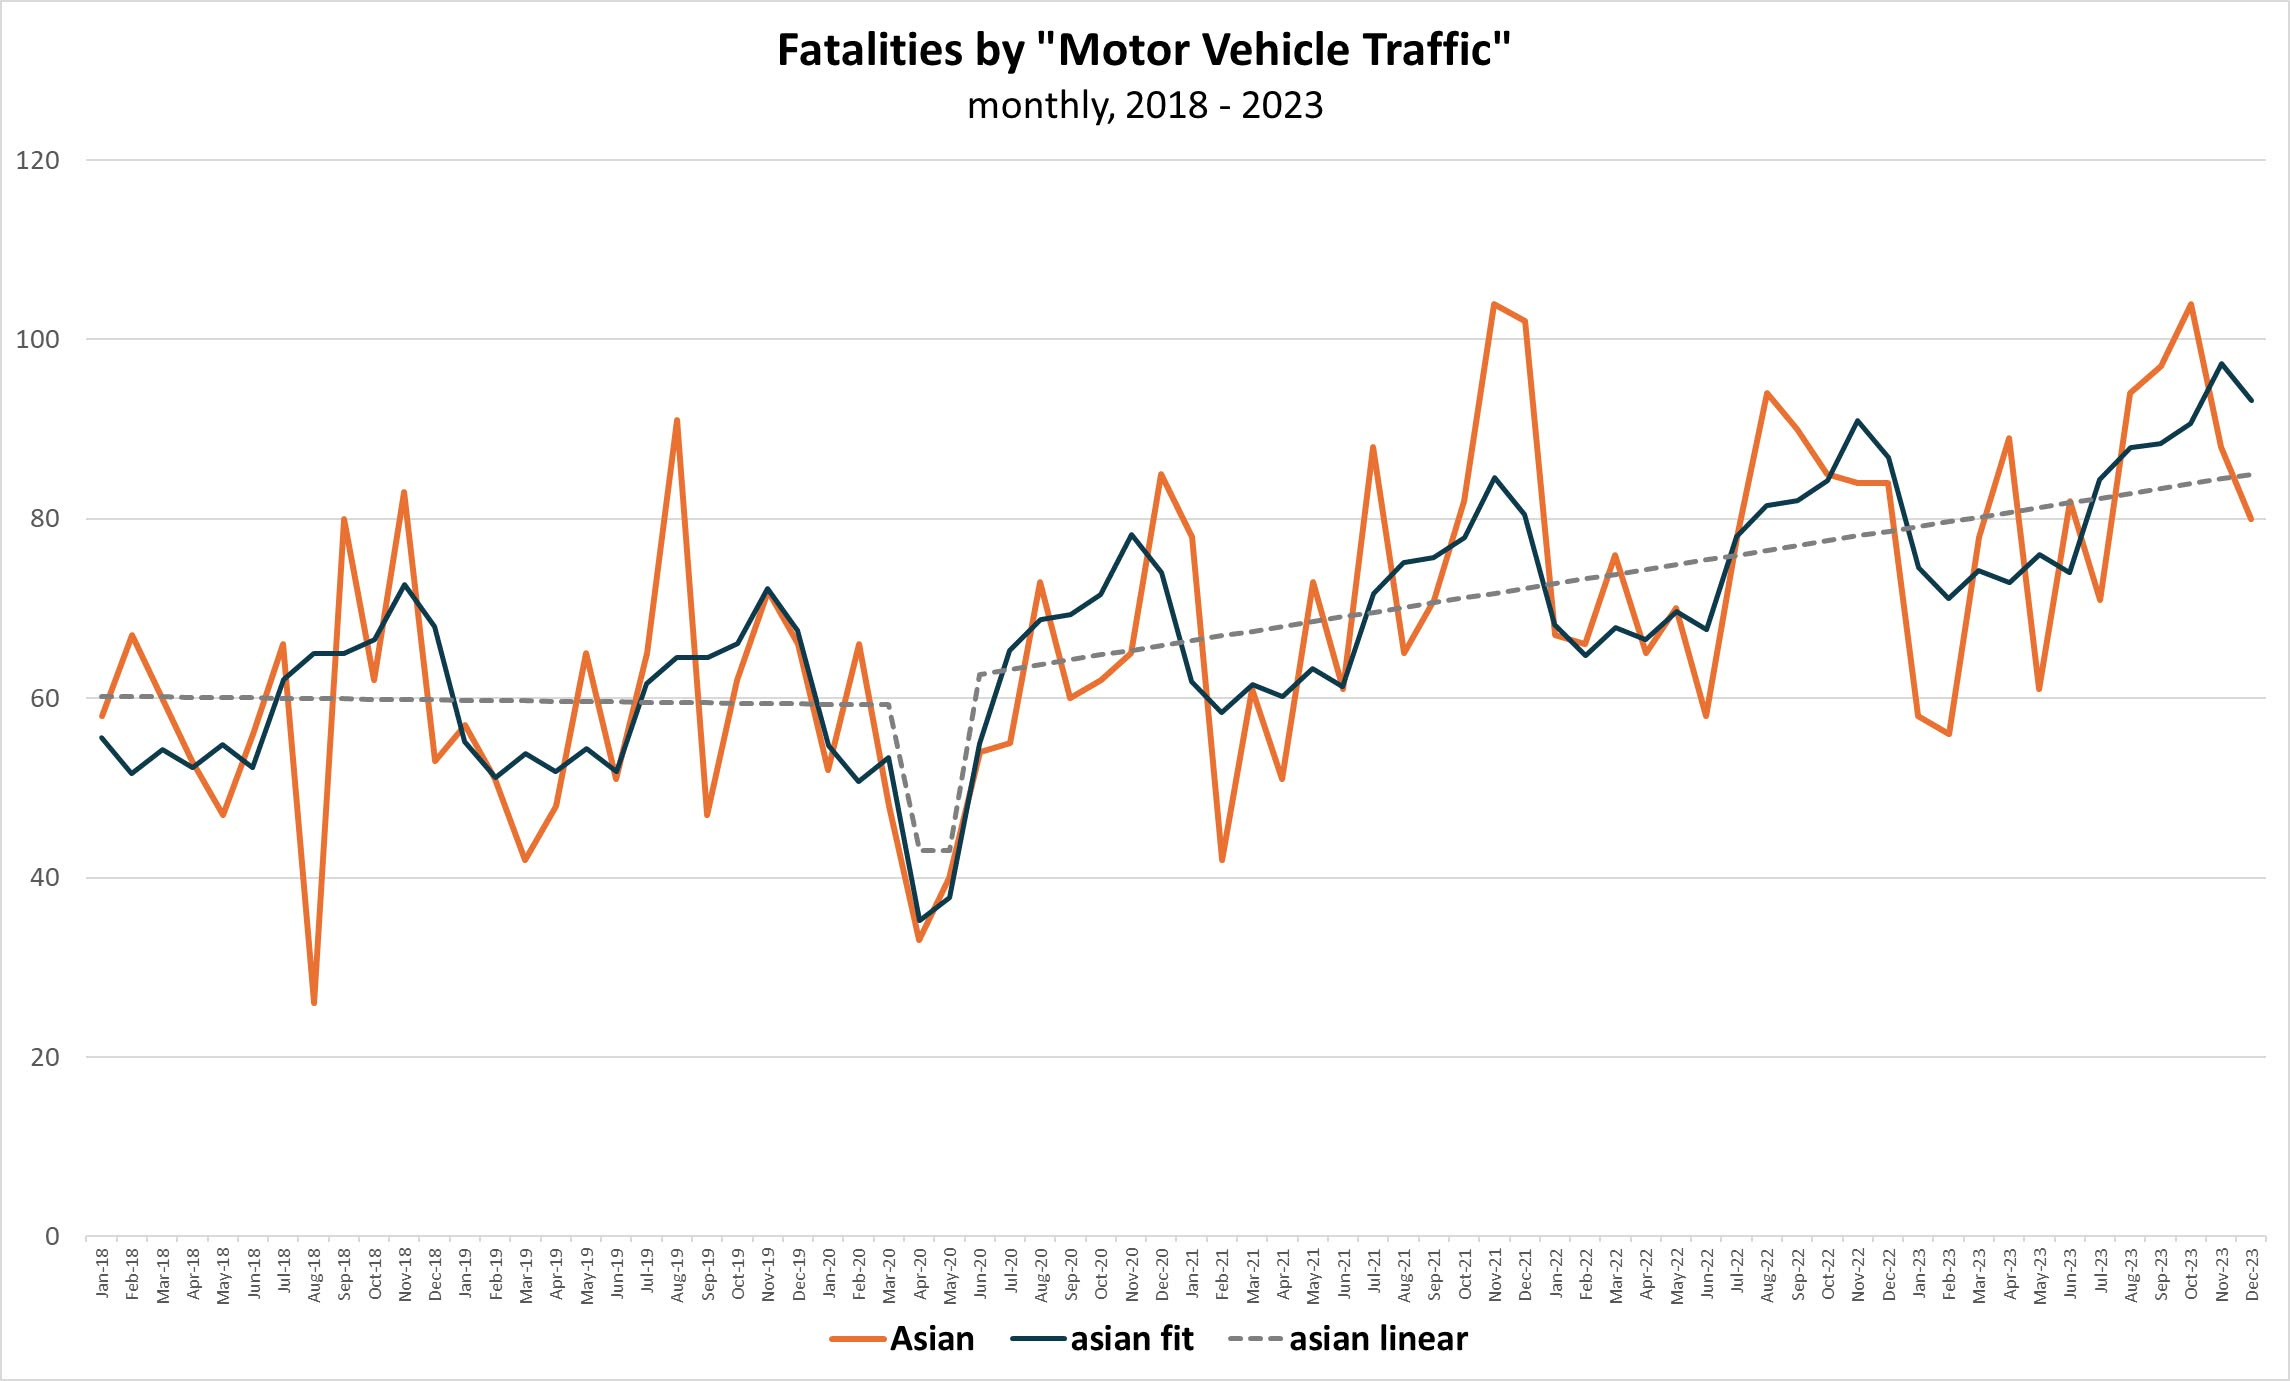
Fatalities among Asians averaged about 60 per month pre-George Floyd and pre-COVID and appear to have dipped during COVID (not a statistically significant result) and they didn’t jump up post-George Floyd. They did, however, start to increase post-George Floyd. This is a robust result: The monthly rate of fatalities among Asians increased about six per year post-George Floyd such that, by the end of 2023, the monthly rate had risen from about 60 to 85.
Now consider Native Americans:
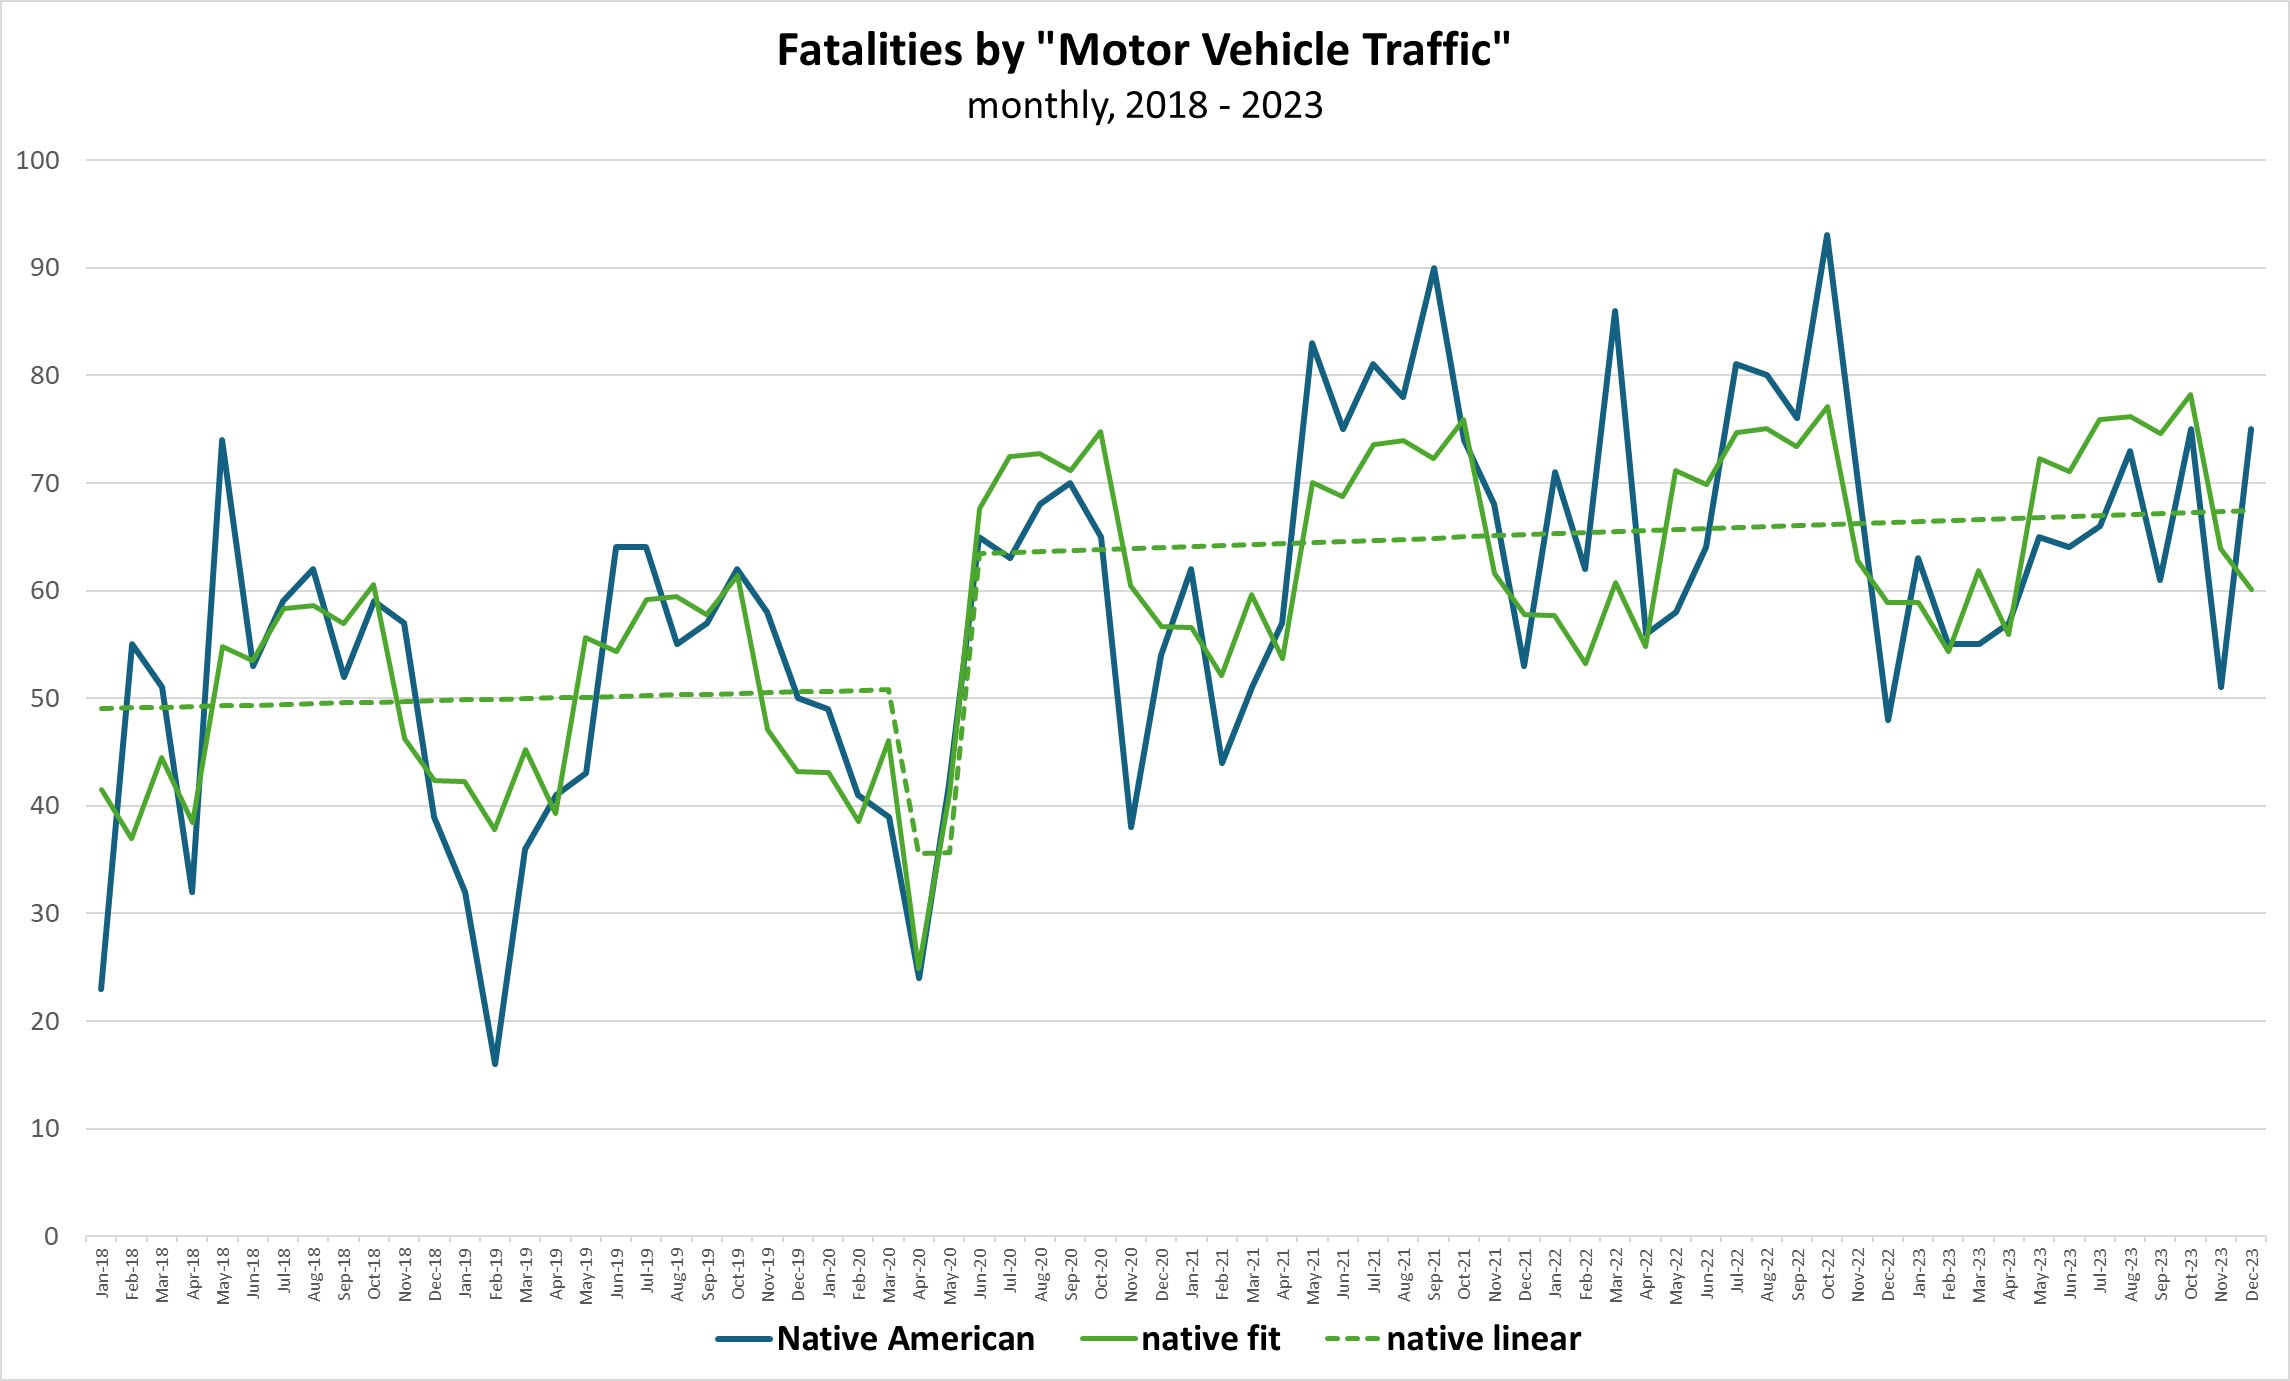
Pre-George Floyd, the average monthly rate of fatalities was flat at about 50 pre-George Floyd. The COVID effect is not statistically robust, but the post-George Floyd increase is. The rate increased from 50 to about 65 per month.
Finally, let’s look at the “white” fatality rate:
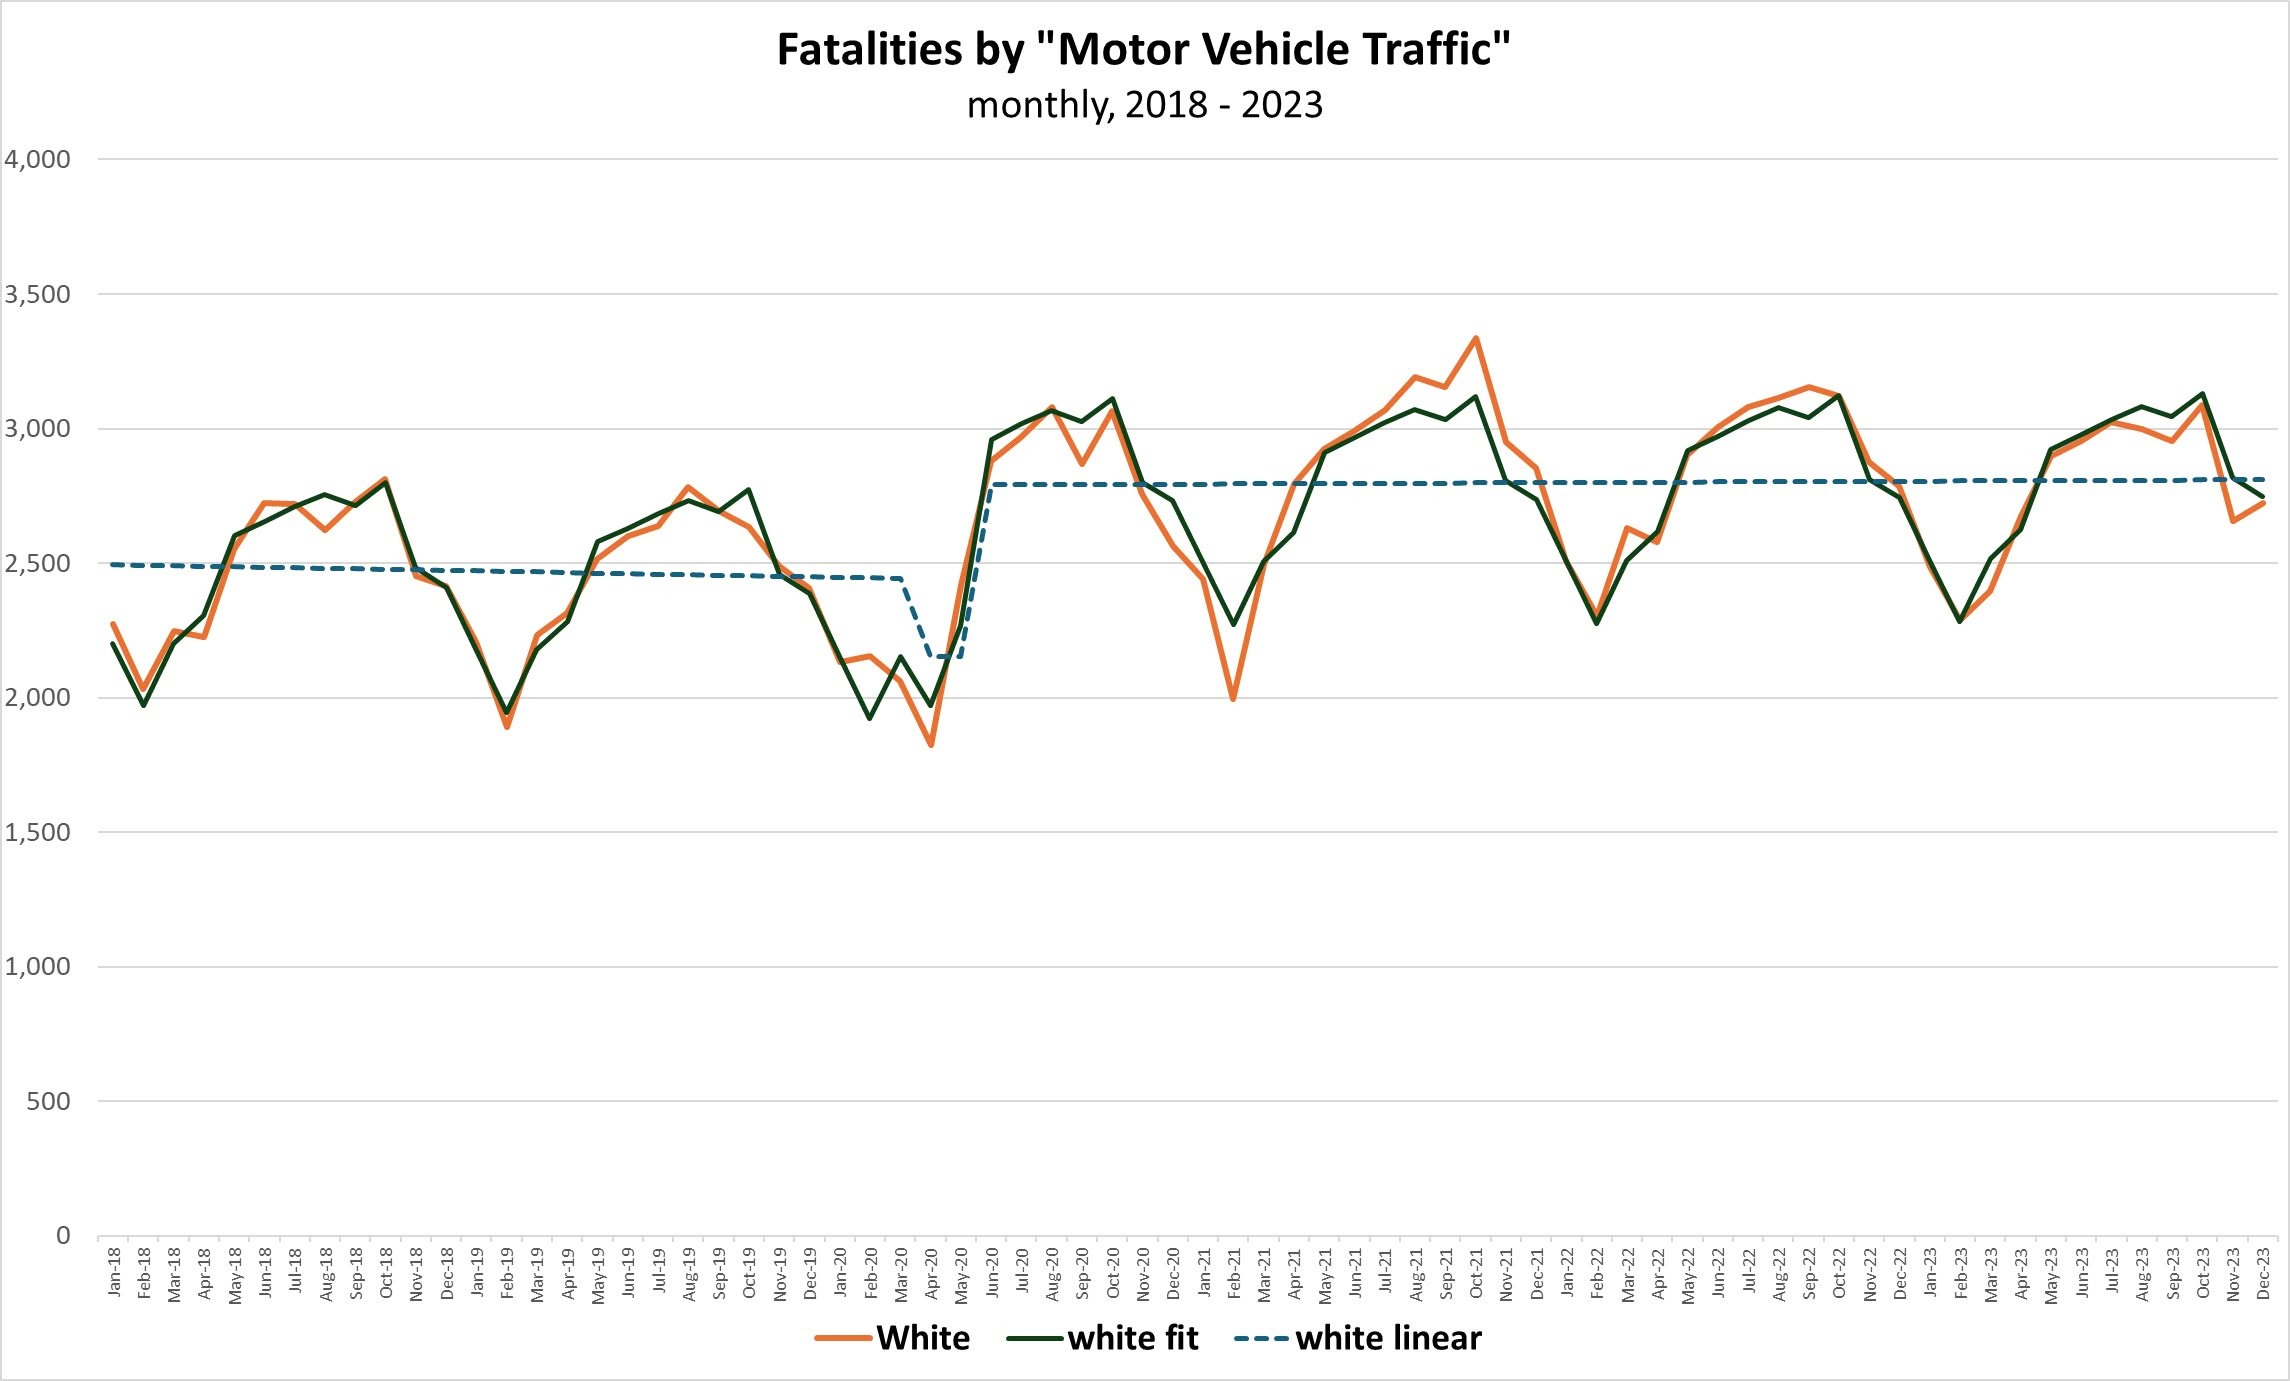
Whites accounted for a monthly average of a little over 2,500 traffic fatalities pre-COVID and pre-George Floyd. There was a statistically-discernible decrease to about 2,150 per month just after the advent of COVID lockdowns, but there was also a statistically discernible jump post-George Floyd from about 2,150 per month to 2,800 per month. That rate held steady through 2023.
What to make of all of this? I do not as yet have data for 2024, but it looks to me that, on average, the authorities nation-wide relaxed traffic enforcement. Driving-While-Black had not obviously been a policing hazard pre or post-George Floyd, just as there really isn’t a Driving-While-White policing phenomenon or a Driving-While-Asian policing phenomenon or a Driving-While-Native American policing phenomenon. The hazard is simply less policing. When it comes to traffic fatalities, we are operating in a low-enforcement/high-fatality equilibrium … unless your black. Black fatalities have been moderating steadily over time. Why? Because bad drivers have been taking themselves out of circulation and the concentration of bad drivers among blacks has decreased? (That’s my guess.) But the concentration of bad drivers among everyone else has not declined?
My ultimate point is that the data on traffic fatalities are easiest to rationalize with the idea that policing nation-wide went through a regime-shift. We went from a high-enforcement regime to a low-enforcement regime. Traffic fatalities shifted from a relatively low and steady level to a discernibly higher and steady level … except among blacks. The level among blacks has been declining as the worst drivers have been taking themselves out of circulation.
This last result suggests to me that we really can end up in a low-policing/lower-fatality equilibrium, and it is then tempting to project this idea on to data on violent crime and suggest that we can also end up in a low-policing/lower-crime (if not low-crime) equilibrium. I will take that idea up in Act Two, but first let me revisit this result:

Homicides in Chicago jumped up from about 40 per month pre-George Floyd to over 70 per month in the immediate aftermath of the George Floyd experience. But, it looks like Chicago has since settled into a low-enforcement/lower-homicide equilibrium. I’d advance the hypothesis that attrition has taken its toll on the population of bad guys. They’ve taken each other off the streets, so we can end up with lower crime even under a low-enforcement regime. Even anti-social public policy can superficially appear prosocial. Indeed, we can imagine the city authorities, who have done nothing but spur on violence and rioting, would yet take credit for lower homicide rates notwithstanding the fact that they’ve done worse than nothing.
Thanks for this interesting article. Regarding your main point that the principal way of reducing violent crime is to get bad guys off the street. Here in the UK we periodically get told by politicians that they will get tough on crime by increasing sentences. But I once heard an interview with a retired police officer in which he pointed out that the thing which deters criminals is not so much as harsher sentences but rather a high probability of getting caught. It turns out that we have neither in the UK since police detection rates for crime is falling and they are releasing even serious criminals early because there is not enough room in the prisons. Unless of course your crime was to send an ill judged tweet.