

Strategic Behavior in Decisions to Conceive, Not Conceive, and to Abort
More than 99% of abortions occur well before the end of the 2nd trimester. More than 92% are in the bag after 13 weeks.

This short essay was inspired by this graph:

Women who proceeded to abort did so in more than 95% of cases by the 15th week after conception.
I secured the underlying data from the CDC’s 2019 edition of its annual Abortion Surveillance report, published November 26, 2021 and posted at https://www.cdc.gov/mmwr/volumes/70/ss/ss7009a1.htm. One can find reports going back decades at https://www.cdc.gov/nchs/fastats/reproductive-health.htm.
Recall that the recent Supreme Court opinion, Dobbs v. Jackson Women’s Health Organization, involved the state of Mississippi rolling back restrictions on access to abortion from about 23/24 weeks after conception to 15 weeks. And, yet, even in Mississippi in 2019, 99.5% of abortions clocked in under the 15-week limit. (See Table 10 of the 2019 Abortion Surveillance report.) So, would rolling back limits from 23/24 weeks to 15 weeks really impinge access to abortion? Not for most people. Is rolling back to 15 weeks really a big deal—politically? Possibly not. And, yet, who are the 0.5% who choose to abort after 15 weeks? Indeed, who are the kind of people who would only opt to abort after a full term of pregnancy?
I have no insights into the fraught decision to abort after carrying a child for nine months. But, I do wish that the media coverage of abortion issues would actually cover abortion. We hear a lot of rhetoric and talking points from the media, but one does not routinely see anyone tee up some evidence about how the abortion phenomenon unfolds.
Complex as it is, the abortion phenomenon comprises just certain aspects of larger dynamic processes. How do people manage families over time? “Family planning” may be a euphemism for abortion, but even it implies that there are very complex processes out there. It implies that people are forward-looking, make some effort to anticipate the consequences of important decisions, and will fold expectations into those important decisions. Those decisions will implicate the decision to abort but also the decision to engage another person in the marriage contract. For a nominal fee, the parties to the marriage contract get access to a whole host of rights and obligations. They secure powers-of-attorney with respect to each other’s end-of-life decisions. They assume superior claims to each other’s assets when one party exits the relationship. Exit might be exogenous (honey-bunny gets hit by a city bus) or endogenous (honey-bunny runs off with the UPS man), but either way, the marriage contract informs how financial resources and obligations get distributed post-exit. It was designed to preserve the security of the partner and children (if any) who remain.
Co-habitation within the scope of the marriage contract; co-habitation outside of the marriage contract; child-bearing; abortion; long-term finances. That is a lot of complex stuff going on. There may be observers out there—the few, the loud, the not-so-proud—who maintain strong ideas about how all of these things relate to each other, but all I am going to say here is that one does not have to dig too far to see how the issues get really complicated and hard to understand really fast. I tuned up the following graph from a cluster of the CDC’s Abortion Surveillance reports[1]:
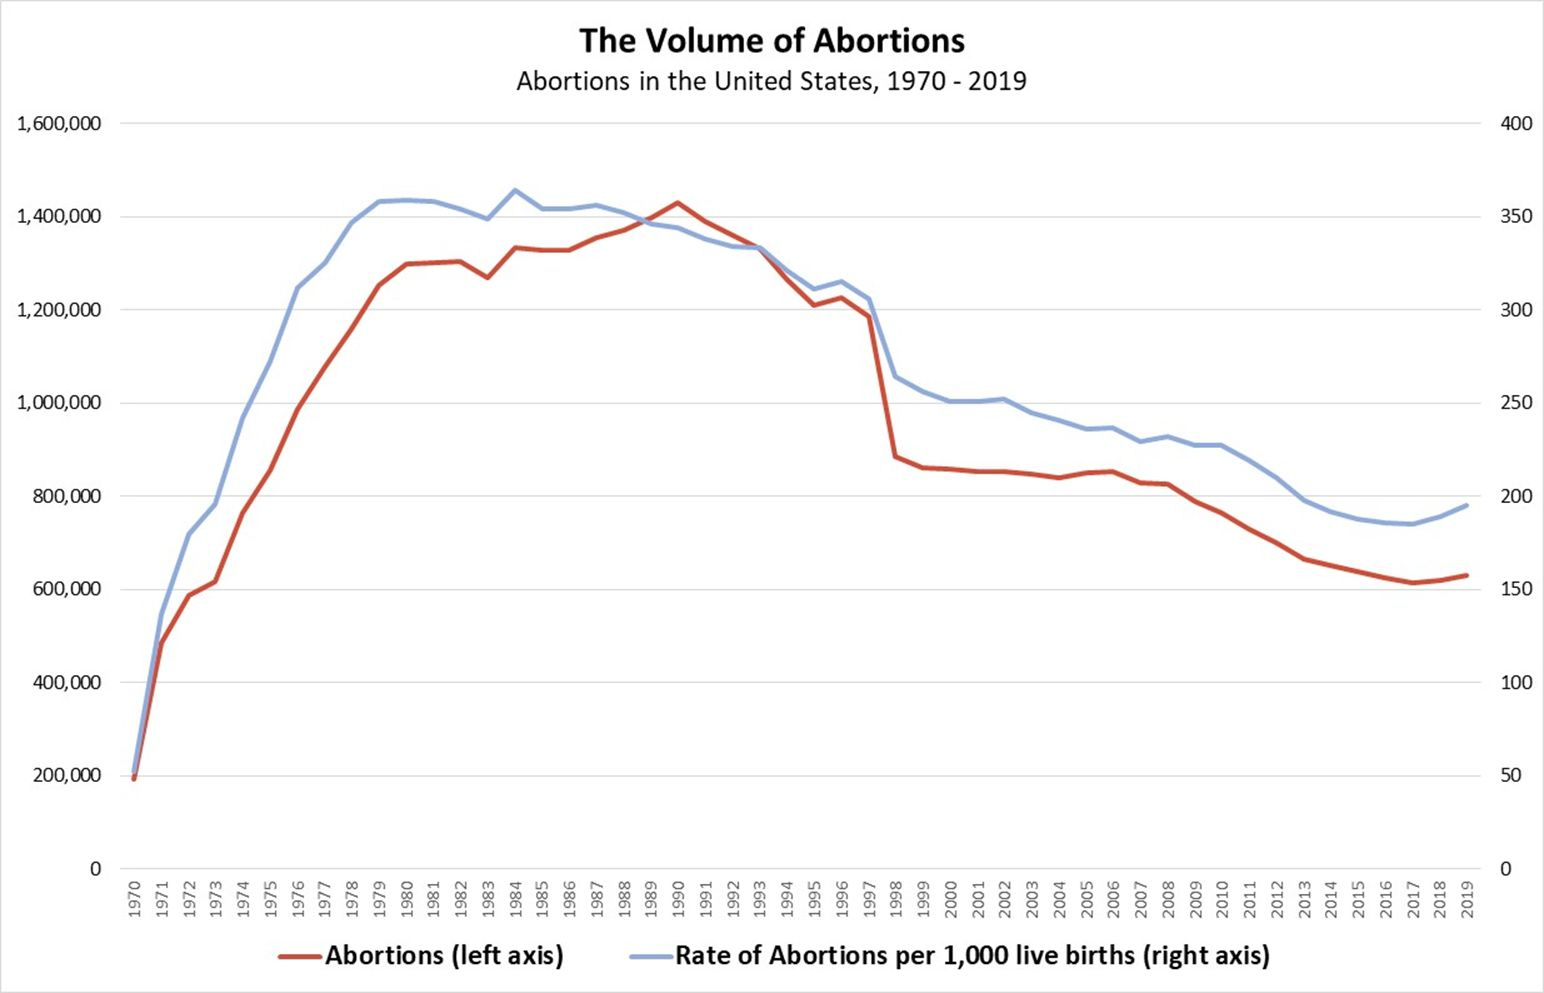
This graph indicates the volume of “legal abortions” from 1970 through 2019 (the red line). Recall that the Supreme Court opinion in Roe v. Wade came out in early 1973. Note, however, that the volume abortions had tripled from about 200,000 in 1970 to 600,000 in 1972. Abortion was available in the United States before Roe, with the state of New York leading the way. So, it looks like demand for abortion had been picking up—Why?—and it continued to increase almost linearly from 1973 through 1980.
The blue line indicates the number of abortions per 1,000 live births. I include it here as a check on the reliability of the counts of abortions (the red line). There is some differentiation in CDC reporting from year to year, but one would hope that the rate of abortions per 1,000 live births would be less susceptible to distortion. In any case, both loci trace out similar trajectories.
Back to main story: Abortions peak with the peak in the “Crack Wars” of the late 1980’s/early 1990’s. (Is there a connection?) The volume of abortions then drops precipitously by one-third between 1997 and 1998. The volume of abortions had been moderating before 1997, but then it fell off a cliff to a much lower level. Why was that?
Abortions leveled off post-1997 before declining again post-Great Recession. (Is there a connection? If so, what is the mechanism?)
There is an enormous amount of action in this graph, and I can’t pretend to definitively rationalize what is going on. It turns out that what is going on is not well understood by anyone. The question of variation over time in abortion rates is up there with questions about variation over decades in crime rates. Not well understood.
That said, let me pose some puzzles and ideas, and, to do that, let me add a few annotations to the graph:
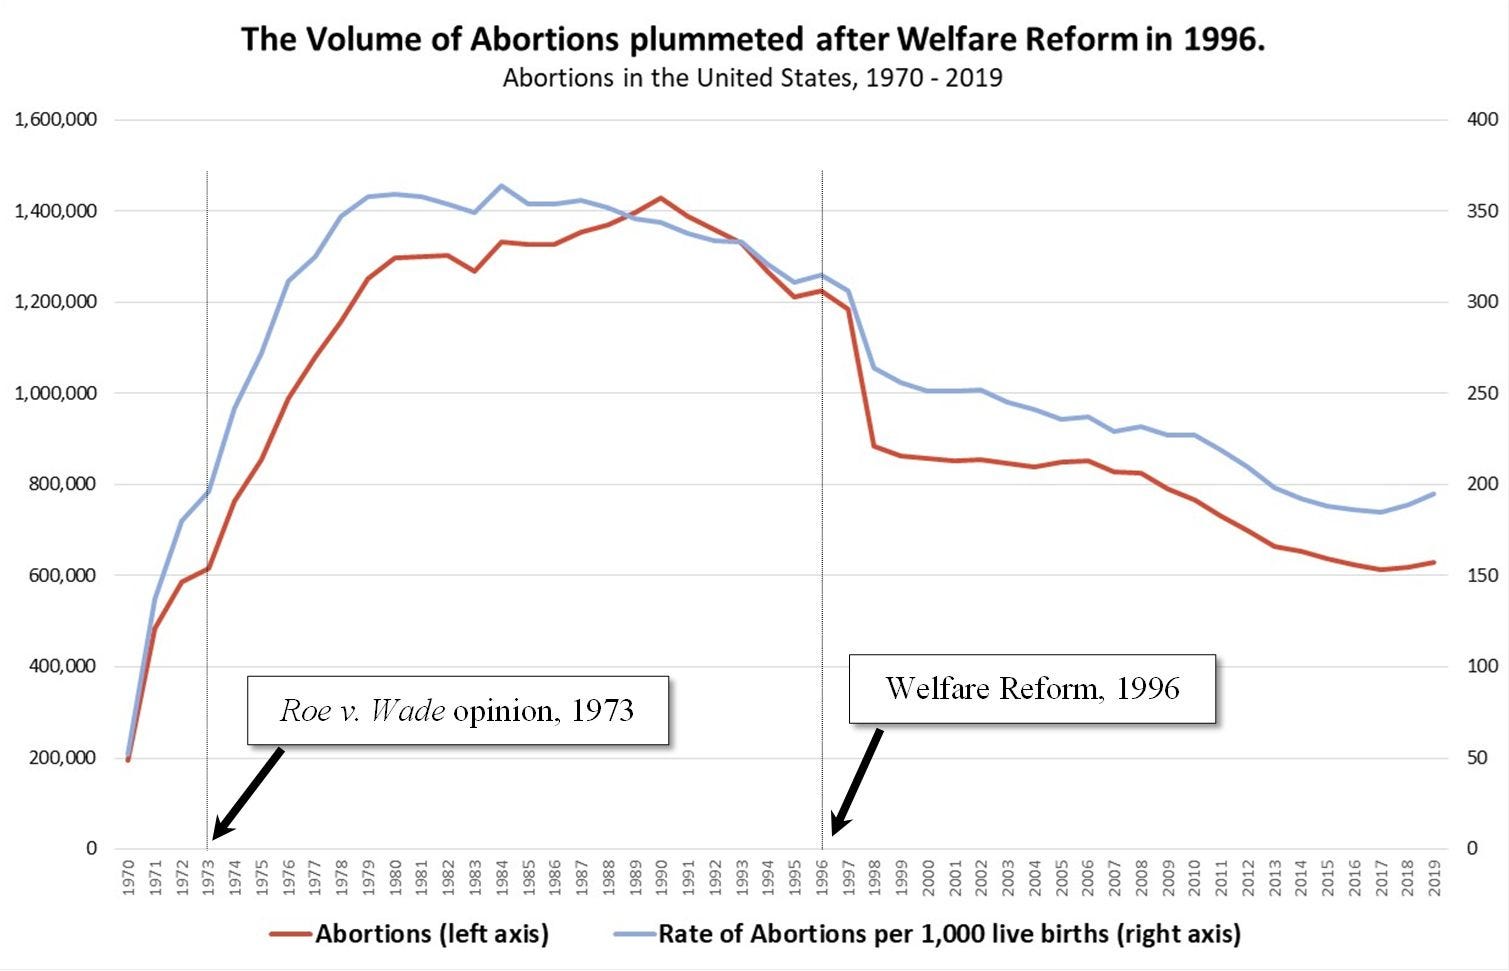
It is hard not to think that the passage of “Welfare Reform” in 1996 had something to do with the precipitous drop in abortions in 1998. One can easily find evidence online of debate pre-welfare reform about how that same reform would affect family formation and abortion, but I have yet to find good stories post-reform about how it did affect these things.
Let me relate a few basic details about “welfare reform” and about some of the rhetoric that preceded its passage.
The legislation in 1996 that delivered “welfare reform” was called the Personal Responsibility and Work Opportunity Reconciliation Act. The Act replaced the program Aid to Families with Dependent Children (AFDC) with Temporary Aid for Needy Families (TANF). Replacing AFDC with TANF largely amounted to imposing limits on the duration of cash benefits. How this was implemented may have varied state to state in that the Act operated as a “block grant” program: the Federal Government would grant each state some fixed volume of funding but would leave it up to the states to do much of the designing and implementation of TANF.
One common idea out there was that TANF would induce women to give up on the idea of developing careers as “welfare queens.” Under AFDC, a woman could secure greater and greater income by having more and more children. TANF might put an end to that, and, indeed, some opponents of “welfare reform” complained that TANF would induce a larger volume of abortions. Women would find that having children post-AFDC might generate lower net benefit. Indeed, having children might induce net costs. Pregnancies that women might have desired under AFDC might then become undesirable post-AFDC. The demands of these same women for abortion would increase.
Other observers argued that the volume of abortions would not increase post-AFDC. An “executive memorandum” titled “The Fallacy that Welfare Reform Will Increase Abortions” from The Heritage Foundation was insistent: “A more generous welfare system clearly undermines the moral norms within a community. It encourages promiscuous sexual activity and discourages self-restraint and marriage, thereby increasing both illegitimacy and abortion.”
There is a lot going on there—promiscuity, marriage, self-restraint, moral norms—and it is hard to know how to evaluate some of these things, but a little accounting can impose some structure. Basically, post-AFDC, some volume of conceptions that would have resulted in abortions could yet result in live births. Conversely, some conceptions that would have resulted in live births would yet result in abortions. But then there is the question of conceiving in the first place. Some volume of conceptions that would have occurred might not occur post-AFDC. Basically, forward-looking agents (women and, possibly, the men they were involved with) might adapt their choices strategically. The net result of everyone evaluating their options post-AFDC might result in net fewer abortions. Or a larger volume of abortions. It was an empirical question.
The only piece I’d stumbled upon that moves in the direction of talking about strategic adaptation of behaviors might be the oft-cited piece, “Welfare Reform and Abortion” by Jacob Klerman in Robert Moffitt, ed. Welfare, The Family, and Reproductive Behavior (1998) published by the National Academy of Sciences.[2] That piece came out, it seems, before data could really speak to the questions. But, we plainly see that the absolute number of abortions declined by about one-third between 1997 and 1998. Meanwhile, the number of abortions as a proportion of all live births declined by about one-fifth. The bit about morals and norms aside, the Heritage Foundation might have been on to something. What I get out of it is: This is stark evidence that people behave strategically. They had gamed the welfare system. An important qualitative change to the system induced an important qualitative change to behaviors.
The idea of “gaming the system” bears a suggestion of … immorality. It is somehow bad to game the system. Rather, folks should respect the spirit of laws and regulations and avoid gaming them for personal advantage, blah, blah, blah... But, it turns out that personal advantage really is an important factor in how people behave, and a lot of the predictive content of economic analysis poses it as an important factor. The authorities design systems. People game them. The authorities reform systems. People then adapt their behaviors to the reforms and end up gaming those reformed systems, too.
So, to recount. “Welfare reform” was designed to undermine incentives to live off of welfare indefinitely. Pro-welfare operatives warned that reform would induce a larger volume of abortions. Pro-reform operatives argued that people would adapt in complex ways such that, less intuitively, they might end up generating a smaller number of abortions. The exact mechanics of a decrease in the volume of abortions might yet prove to be a little hard to untangle. Would candidate “welfare queens” more likely avoid getting pregnant in the first place? Would some of them yet resort to abortion rather than carry pregnancy all the way to live birth? The ultimate result is that abortions declined precipitously.
Before closing, let me tee up one more graph that I assembled using data from a handful of the CDC’s Abortion Surveillance reports:
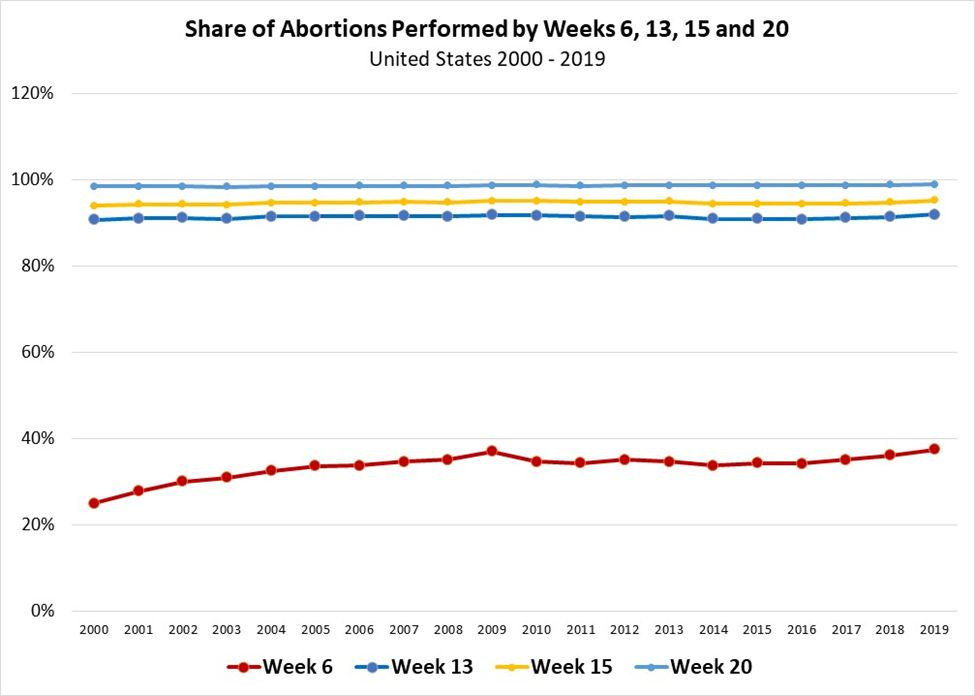
From 2000 through 2019, women have pulled the trigger on about 95% of abortions by the 15th week after conception. That number is stable over those twenty years. There is, however, some action at Week 6. In 2000, a little under 30% of all abortions clocked in at 6 weeks or less. The number approached 40% in 2009—perhaps there was a Great Recession effect at work—and it bubbled up again towards 40% over the last few years. So, there is some action in these data at the low end. It's not obvious what drives it.
Perhaps improvements in technologies to ascertain the condition of the fetus informs part of what is going on. There’s a tricky, fraught topic. What would one choose to do if one knew that one’s child was likely to be born with a debilitating condition? With Downs Syndrome, say?
Here's a photo in 1937 or so of a cheery young German fellow who might not have been allowed to survive a high-tech screening. The Nazi regime made a big point of getting rid of such people:
And here’s another young fellow with his younger brother and sister in 1937 or so:

I do not know much about this young lad, but it had been explained to me that he had been born with some issues. He died at the age of 13 in a terrible incident. (Another young lad had gotten hold of a pistol. He pointed the pistol at the this fellow and pulled the trigger. The pistol was loaded.) That’s a story for another time, but I do know that he was deeply loved and deeply missed. I’d even suggest that it is not obvious that his parents ever really got over it.
[1] See Tables 10, 10 and 11, respectively, from the CDC Abortion Surveillance reports for the years 2008, 2009 and 2019: https://www.cdc.gov/mmwr/preview/mmwrhtml/ss6015a1.htm, https://www.cdc.gov/mmwr/preview/mmwrhtml/ss6108a1.htm, https://www.cdc.gov/mmwr/volumes/70/ss/ss7009a1.htm.
[2] One can download individual chapters or the entire book for free at https://nap.nationalacademies.org/catalog/6133/welfare-the-family-and-reproductive-behavior-research-perspectives.
Great research, thanks. Does really bring out the current much-ado over nothing on both sides. Pity these data aren't typically published widely.