What kinds of students have fared best or worst post-COVID?
What data can say and cannot say about the effect of public school closures
Summary results —
Performance on the annual “Standards of Learning” (SOL) assessment exams across all school districts in the state of Virginia deteriorated sharply in 2021 and 2022 relative to performance pre-COVID in 2019.
Performance in Reading appears to have been least affected by school policies implemented in 2021 and 2022 relating to in-person instruction.
Rather, performance in Mathematics and Science seems to have deteriorated the most in response to the shift away from in-person instruction to remote, online instruction.
The deterioration in performance was not uniformly distributed across students differentiated by income and race.
Students in wealthier school districts have tended to secure disproportionately high shares of “passing,” “proficient” or “advanced” scores on SOL exams in Reading, Writing and History.
Students in wealthier school districts secured disproportionately higher shares of “passing” or “proficient” scores on SOL exams in Mathematics and Science, but they did not secure disproportionately higher shares of “Advanced” scores.
The best performing students and the worst performing students have tended to be concentrated in non-rural areas.
Performance gaps between black students and other students, if any, did not increase post-COVID among the highest performing students. In contrast, performance gaps increased among lesser performing students. Disproportionately more black students failed their SOL exams in 2021 and 2022.
Performance gaps between Hispanic students and other students, if any, did not increase post-COVID among the highest performing students. In contrast, performance gaps increased at lower levels. Disproportionately more Hispanic students failed their SOL exams in 2021 and 2022.
The performance of Asian students has been concentrated at the highest level (“Advanced”) and the lowest level (“Fail”).
Asian students’ performance in Math and Science at the highest level suffered the most post-COVID as students who would have secured “Advanced” scores ended up securing “Proficient” scores.
The overall deterioration in performance was disproportionately concentrated on black and Hispanic students who would have otherwise secured “passing” or “proficient” scores on SOL exams.
With school assessments such as the National Assessment of Educational Progress, “the nation’s report card,” having come out for 2022, one can easily find headlines about how the performance of public school students still lags pre-COVID performance. “We know the school closures did this,” avers Karol Markowicz in the New York Post on September 1, 2022. “It wasn’t the COVID virus. It was the hyper-political reaction, from the left, on reopening schools during the pandemic.”
The general proposition is that if schools had persisted in doing post-COVID what they had been doing pre-COVID, then we should not have observed precipitous declines in standardized test scores post-COVID. Indeed, but one can only wonder if the politics of COVID in 2020 would have enabled any state or school district to defy demands to supplant regular, in-person instruction with remote, online instruction just as the COVID hysteria was mounting. That said, excuses for not moving back to in-person instruction in 2021 and 2022 would seem to be less robust.
In this essay I take up standardized testing in the state of Virginia. Virginia has implemented its own testing regime, its annual “Standards of Learning” (SOL) assessment. Federal regulation allows the state to implement its own regime of standardized tests.
The state of Virginia forced all public schools to close to in-person instruction in March 2020 and then suspended the SOL assessment it would have conducted that spring. Most schools opened to some mix of in-person and online instruction in the following 2020/21 school year with only two school districts declining to offer students some measure of in-person instruction. The state then required that all school districts offer the option of in-person instruction in the following school year of 2021/22.
The state did re-engage its annual testing regime in the spring of 2021. After the results of the 2021 assessment rolled in, the Virginia Department of Education (VDOE) put out a press release dated August 26, 2021 to get ahead of the expected criticism of conspicuously diminished performance.[1] The “2020-2201 SOL Test Results Reflect National Trends, Unprecedented Challenges.” And, going forward, the “Results Set Baseline for Recovery.”
I would suggest that it not obvious that the 2020/21 assessment set a baseline for anything but rather reflects the breakdown of the public school system in the year succeeding the advent of COVID. The VDOE might even agree in that it observed:
The SOL pass rates in 2020-2021 were anticipated by school divisions and VDOE, given the impact of the pandemic as reported on local assessments administered earlier in the school year… Last year was not a normal school year for students and teachers, in Virginia or elsewhere, so making comparisons with prior years would be inappropriate.
Performance suffered, Because COVID, the VDOE averred. One can always deny responsibility for anything by making amorphous appeals to the “impact of the pandemic.”
One motivation for annual testing—perhaps the principal motivation—might be to gauge changes in performance over time in response to changes in instruction. That said, a review of VDOE memoranda over the years reveals that it has tweaked or re-engineered its testing regime from time to time. It is not obvious, therefore, that comparing one year to the next may amount to an “apples-to-apples” comparison. There are a lot of oranges in the mix. Consider, for example, evidence of changes in the mathematics assessment regime:
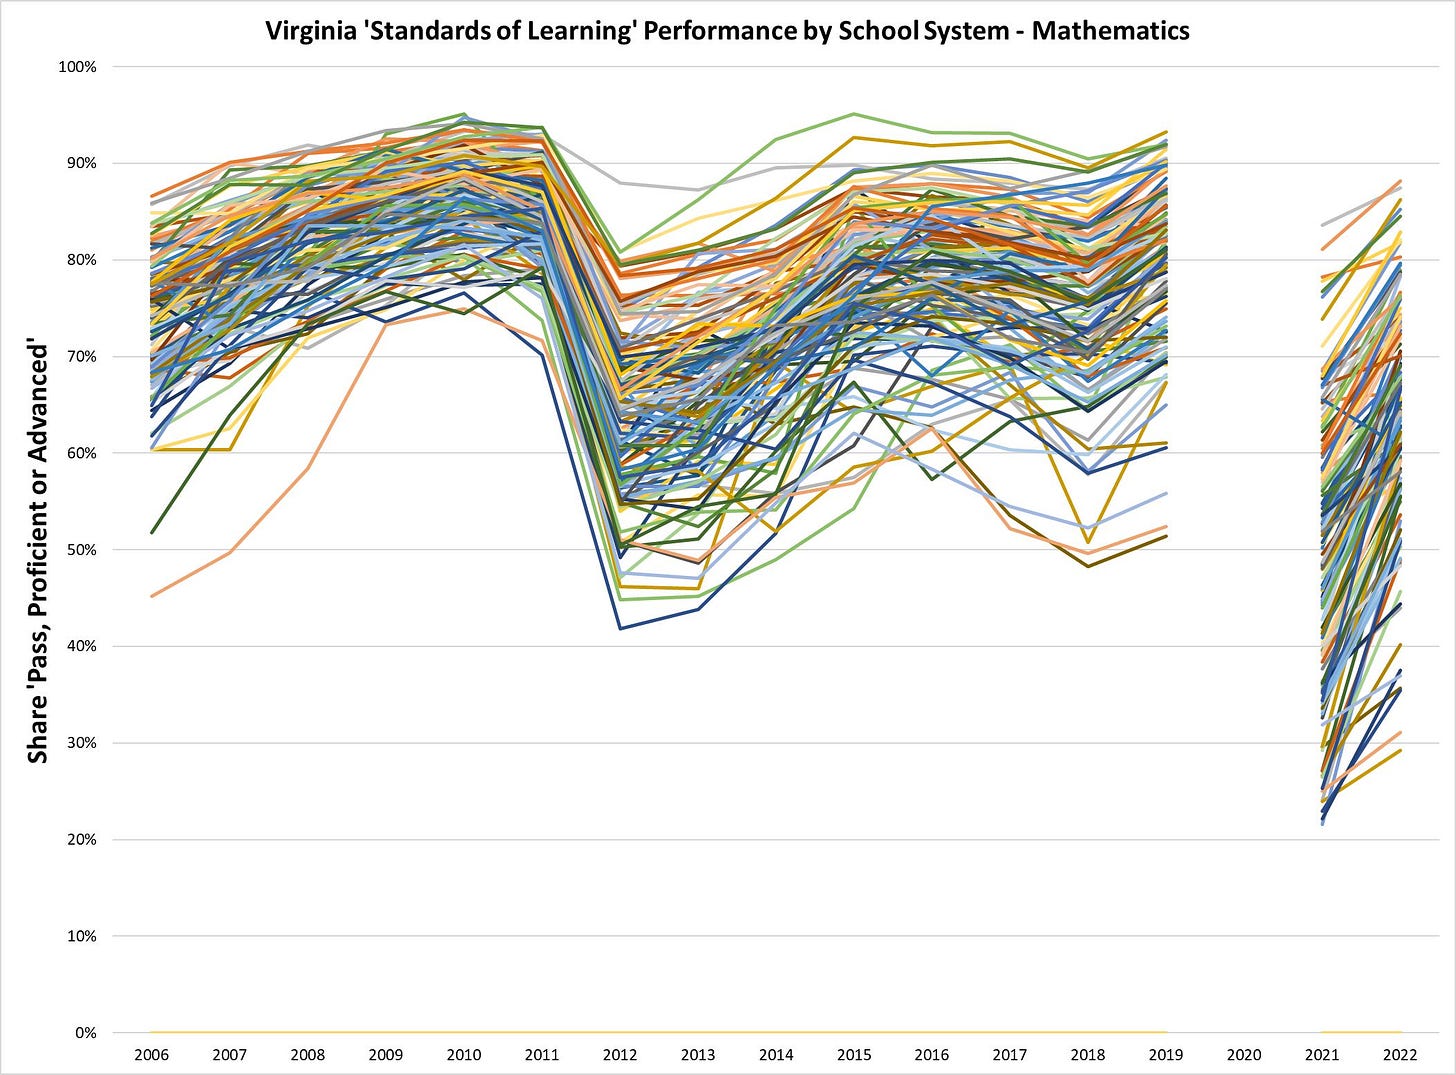
This graph maps the share, by school system, of students who had “passed” the mathematics assessment in each year from 2006 through 2022 with either a “Passing” score, a “Proficient” score, or an “Advanced” score. The sharp drop from the pre-COVID scores in 2019 to the post-COVID scores in 2021 is obvious. The fact that scores have, on average, failed to recover by 2022 to pre-COVID levels is also obvious. No less conspicuous is the sharp decline state-wide in scores in 2011. Such changes likely resulted from changes from one year to the next is test content. But there are other changes that can complicate comparisons of state-wide performance from year-to-year. In some years the state has exempted the highest performing schools from SOL assessment.[2] One could expect that exempting the best schools would amount to non-randomly changing the composition of the population of test takers in a given year. And then the 2021 assessment featured its own, special non-random effects. Specifically, the state had typically made some allowances for students who had failed specific exams to take them again in a given year. But, in 2021, the number of exams administered dropped by nearly 40%. The state ascribes that decline to a precipitous decline in do-overs.
So. What are the annual assessment data good for, and what are they not good for? They are not uniformly good for comparing state-wide performance, or even system-specific performance, between any two given years. Specifically, one cannot obviously treat data from two randomly selected years as quasi-experimental data when it comes to comparing changes in instruction. Rather, one may have to be very judicious in selecting years to compare. The reason is that, while instruction may or may not have changed between any two given years, the state may have implemented other changes such as changes in test content or, as in 2021, changes in the administration of tests. That said, some years could support such comparisons, but one would have to be careful in choosing years. Some years could also support quasi-experiments in changes in test content. Assuming methods of instruction remained constant one year to the next, how did students perform in the face of changes in content?
This essay was motivated by the idea that one might be able to draw interesting correlations between performance and the decisions of some school districts to offer in-person instruction post-COVID and the decisions of others to stick entirely to remote, online instruction. Amazingly, we do have data from one school year (2020/21) that reveals something about school district policies with respect to in-person instruction, but only two school districts out of 132 districts strictly barred in-person instruction in that year.[3] It would help to see more variation in the data, and it would help to have more than one year of data. It is not obvious that schools had developed and implemented mature processes in the 2020/21 school year. No less importantly, the decisions to offer (or not offer) in-person instruction in 2020/21 were just that: decisions. They are not random choices. School districts with certain attributes may have been more likely to offer liberal access to in-person instruction. Differently endowed school districts may have been more likely to suppress access to in-person instruction.
One thing one can say is that students in certain types of school districts were much more likely to secure a high share of remote online instruction and a low share of in-person instruction in the 2020/21 school year. (I discussed this in essays dated August 28 and September 2.) I have since assembled a dataset that is richer in school district attributes and can go some way toward characterizing what kinds of students tended to end up with remote-only instruction.
The following table indicates correlations between the share of students who had secured purely online, remote-only instruction in 2020/21 versus those had managed to secure some share of in-person instruction. The correlations derive from three multivariate analysis (linear regressions). Coefficient estimates highlighted in dark blue are both positive and statistically significant at either the 5% or 1% levels. (Light blue indicates statistical significance at the 10% level.)
The first column indicates the results of the first regression: Students coming from counties with higher median incomes were much more likely to go all-remote all the time than students coming from less affluent counties. The coefficient estimate of 1.42E-06 says that a student coming from an affluent featuring median income of about $90,000 would have been, on average, about 71% more likely to end up in remote-only instruction than a student coming from a county featuring median income of about $40,000. (1.42E-06 x 50,000 = 71.00%)
Similarly, students coming from districts featuring higher shares of black students or Hispanic students would have been much more likely to find themselves with remote-only instruction in 2020/21.
The second column regresses the county share of students in remote-only instruction against a measure of the ideological leanings of voters in the county. That measure is the share of voters who voted for the Democratic candidate for governor in the most recent gubernatorial election. The coefficient estimate says that nearly 93% of students in a hypothetical county that had voted 100% for the Democratic candidate would have ended up in remote-only instruction. Basically, students in “blue” counties tended to end up with remote-only instruction. Students in “red” counties were much more likely to end up with some appreciable share of in-person instruction.
The last column indicates the results of a regression featuring all of the variables. It basically says that factors that tend to be correlated with ideology do a better job than ideology itself in indicating which counties would tend to favor remote-only instruction. And, sure enough, the following regression of the Democratic vote share against school district attributes demonstrates that wealthier, urban districts that spend more per student also tend also to be “bluer.” Similarly, districts serving larger shares of black, Hispanic or Asian students tend to be bluer. These are the same districts in which students were more likely to end up with remote-only instruction.
In all that follows, I put aside ideological orientation, and I even put aside the measure of expenditures per student. I put aside expenditures per student for two reasons. The first is that I do not have such numbers for the 2021/22 school year, and it is important to include 2021/22 if I can justify doing so.[4] The second is that I can justify doing so in that those numbers do not enrich analyses of other years, anyway. Performance appears invariant to expenditures per student. That is an interesting result in itself. There is much variation in spending per student across school districts in Virginia, but, even after controlling for other attributes like median income by county or the racial makeup of a student body, higher spending has no appearance of making a difference. It also means that we can put spending per student aside in other analyses.
I illuminate correlations between students’ collective performance by school district and a host of school district attributes. Those attributes include:
Median income by school district
Population density by school district
The share of full-time students in a district who are black
The share of full-time students in a district who are Hispanic
The share of full-time students in a district who are Asian
A little jarring, is it not, that the authorities endeavor to track performance by race and ethnicity—as if the individual is one’s race or ethnicity?
I include dummy variables for each year excluding 2019. The year 2019 will act as a baseline for average, state-wide performance, and the dummy variables for all of the other years will illuminate differences between those years and the 2019 baseline. Those dummy variables also go far towards controlling for differences in the design of SOL exams or administration of SOL exams from one year to the next. I highlight performance in the post-COVID years 2021 and 2022, and I interact year dummies for 2021 and 2022 with school district attributes.
I then regress measures of performance (by school district) against school district attributes, year dummies, and year/attribute interaction terms. I use three measures of performance:
The share of students in a district who performed at “advanced” levels on a given SOL exam
The share of students who performed at the “proficient” level or higher (“advanced”) level
The share of students who secured a “pass” or higher level of performance (“proficient” or “advanced”)
All other test results count as “fail”.
I assembled data for all school districts/counties for the years 2010-2022, although, recall that the state had suspended SOL exams in 2020.
For each of five subject areas, I end up doing three regressions. Each regression spans as many as 1,560 district/year datapoints. The regression results with respect to Reading and Mathematics enable me to make most of my points.
What does this mean?
Each regression amounts to comparing the performance of a hypothetical, benchmark student who attends school in a hypothetical, benchmark school district/county in a benchmark year (2019). The student is a racial composite (mostly white with some Pacific Islander and Native American mixed in). A hypothetical county may be “Average County”. Such a county is average in that it maintains the average of the median incomes of all counties and maintains the average of population density. It is neither entirely rural nor urban.
The performance of a benchmark student in a benchmark county allow us to characterize differences across students and counties that deviate in important ways from the benchmarks. Some counties will be wealthier than Average County. Do they outperform tend to outperform Average County? Some counties will be more urban or more rural than Average County. Will the performances of such counties deviate from the average?
Each regression illuminates correlations between SOL performance and (1) the attributes of school districts and (2) year dummies indicating the post-COVID experience. These correlations do not necessarily illuminate causal effects, although, taken all together, one can’t help but conclude that the policy of frustrating access to in-person instruction did cause performance on SOL exams to fall. Perhaps far into the future schools might settle on a mature, effective program that blends in-person instruction with online instruction, but that time is not now and was not the last two years.
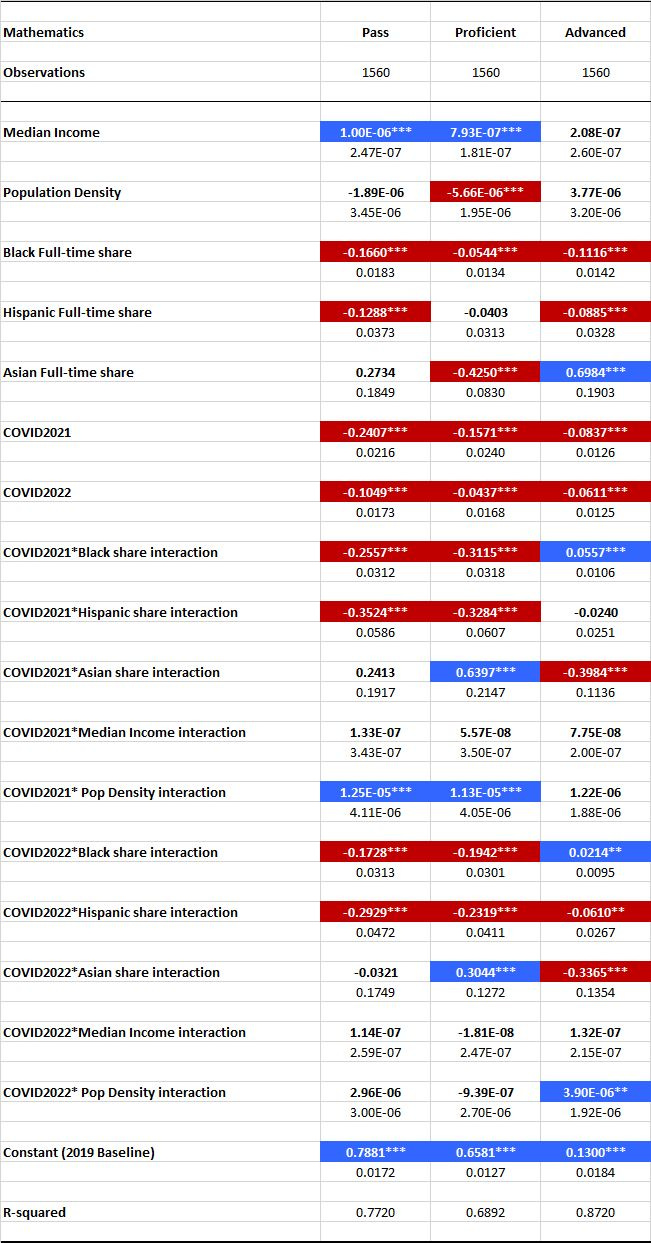
Let’s examine the multivariate regression analyses for “Mathematics”:
The coefficients highlighted in DARK BLUE are positive and statistically significant at the 1% and 5% levels (indicated by the annotations *** and ** respectively). The coefficients highlighted in RED are negative and statistically significant at the 1% and 5% levels. The numbers below the coefficient estimates are standard errors of those same estimates. Taking the ratio of coefficient estimates over those standard errors yields those familiar measures of statistical significance, t-statistics.
Here is an example of how to read this table:
Start with the coefficient on the Constant (2019 Baseline). It indicates that, before factoring in county specific attributes, the baseline share of students state-wide who had secured “Advanced” status in 2019 was 13.00%; about one in eight students scored “Advanced”. But, note that school districts featuring a high proportion of Asian students would have generated a much higher share of “Advanced” scores. Specifically, a hypothetical school district in which 1 in every 3 students were Asian would, other things equal, have secured another 23 points in “Advanced” scores. (One-third times .6984 just exceeds 23% or 23 points.) That same district would have experienced a reduction of about 6 points in “Advanced” scores in 2022. (The coefficient on the 2022 dummy variable, labeled “COVID2022,” is -0.0611 and is statistically significant.) It gets worse. The interaction term COVID2022*Asian share is very negative. That one-third Asian student body would bring down the proportion of “Advanced” scores by about 13 points in 2022. Meanwhile, note that median income and population density do not align with any appreciable change in the proportion of students securing “Advanced” status. The coefficient estimates are not statistically distinguishable from zero.
Suppose, finally, that all of the other students in our hypothetical county correspond to our benchmark students (white with some Pacific Islander and Native American blended in). That county would generate a proportion of about 13% + 23% – 6% – 13% = 17% students who would have secured “Advanced” status on the mathematics SOL exam in 2022. Not bad. (I treat all of the statistically insignificant coefficient estimates as zero.) In 2019, that same hypothetical school district would have generated a proportion of 37% of students securing “Advanced” status. That makes for a precipitous 20 point drop between 2019 and 2022.
There is a conspicuous and large correlation between the proportion of “Advanced” scores and the proportion of Asian students in a school district. Note, however, that the proportion of students securing the combination of “Proficient” and “Advanced” scores goes down sharply as the share of Asian students goes up. How could this be? It means that Asian students are concentrated in the extremes. A lot them are performing at the “Advanced” level, but very nearly as many of them must also be failing. Thus, just having a lot of Asian students in the school system does not necessarily yield a higher-than-average proportion of non-failing scores, but it does generate a lot of “Advanced” scores. Interesting.
Note that the performance of these high-scoring Asian students declined sharply in 2021 and 2022. (The coefficient estimates on COVID2021*Asian share and COVID2022*Asian share are very negative and statistically significant with respect to “Advanced” scores but very large and statistically significant with respect to “Proficient” scores.) A lot of Asian kids fell out of “Advanced” status and into “Proficient” status in 2021 and 2022.
Note that school districts with larger shares of black students also tend to generate a lower volume of “Advanced” scores. (The coefficient estimate is -0.116.) Such a hypothetical school districts also generates a lower share of “Proficient” and “Passing” scores. But note that the performance gap, as measured by the proportion of “Advanced” scores, narrows in 2021 and 2022. (The coefficient estimates on the interaction terms COVID2021*Black share and COVID2022*Black share are positive and statistically significant.) At the same time however, performance gap as measured by “Pass” or “Proficient” drops precipitously in 2021 and 2022. Taken all together we get this pair of qualitative results: High-performing black kids may have been hit hard by the school experience during COVID—just like all kids—but they proved to be more resilient than others. Not so black kids who had been functioning at the “Proficient” or “Pass” level. A lot of them failed their exams in 2021 and 2022.
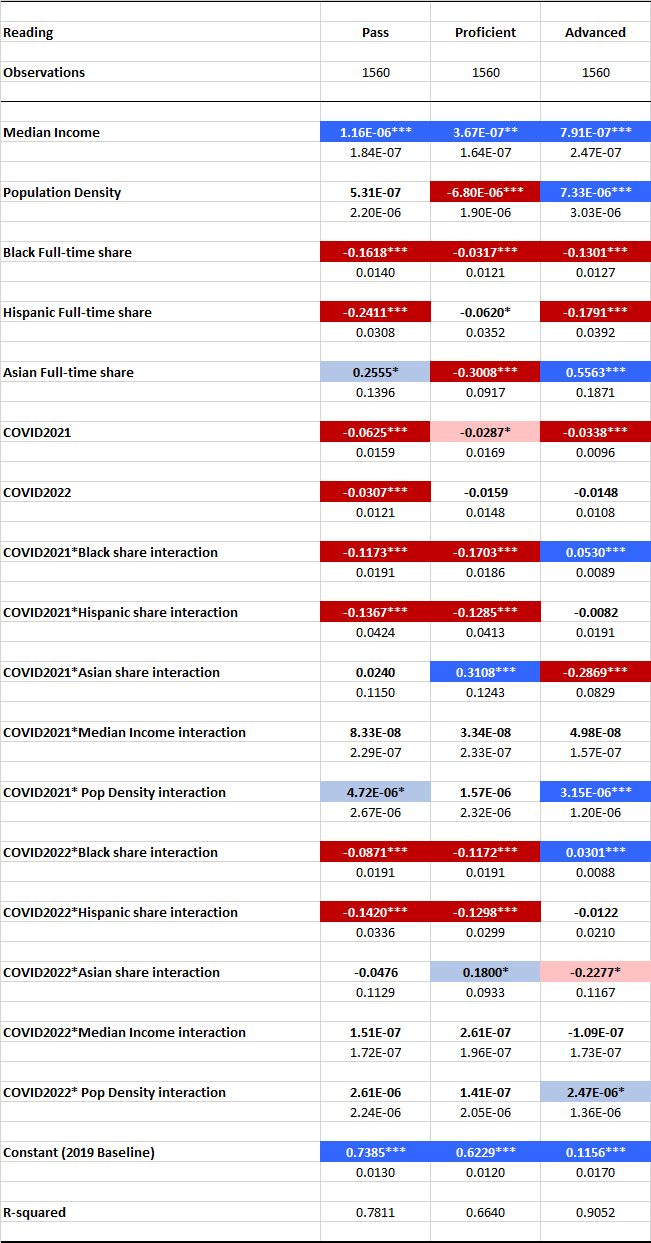
Performance on the “Reading” exams very closely parallels the performance on the math exams, but the results are a little less extreme.
Asian students raise the share of “Advanced” Reading scores but may not raise the share of “Passing” scores overall. So, again, Asian students are either performing at the highest levels or are failing the reading exams. Black students generate a lower proportion of non-failing scores, but, again, the highest performing students appear to be more resilient in the post-COVID years of 2021 and 2022. Not so the lesser performers. The performance gap between them and the hypothetical, benchmark student increases in 2021 and 2022. The same goes for the performance of Hispanic students.
As far as Hispanic students go: The Virginia data did identify the share of “migrant” students in each school district in each year. I had included a “Migrant” variable in the analyses, but the “Hispanic” variables subsume its influence. I excluded it going forward.
The Hispanic experience parallels that of black students. All students performed worse in the post-COVID years of 2021 and 2022, but the performance gap (if any) between Hispanic students and the hypothetical, benchmark student did not change in 2021 and 2022.
Other results:
An urban/rural effect does show up across all five subject areas: the more urban, the higher the concentration of “Advanced” scores in place of “Proficient” scores.
Wealthier counties perform better at any level in Reading, Writing and History. A wealthy county outpacing a poorer county by $50,000 in median household income may generate 2 to 7 points in extra “Passing”, “Proficient” or “Advanced” scores.
Wealthier counties also exhibit greater performance in Mathematics and Science except at the highest level (“Advanced”).
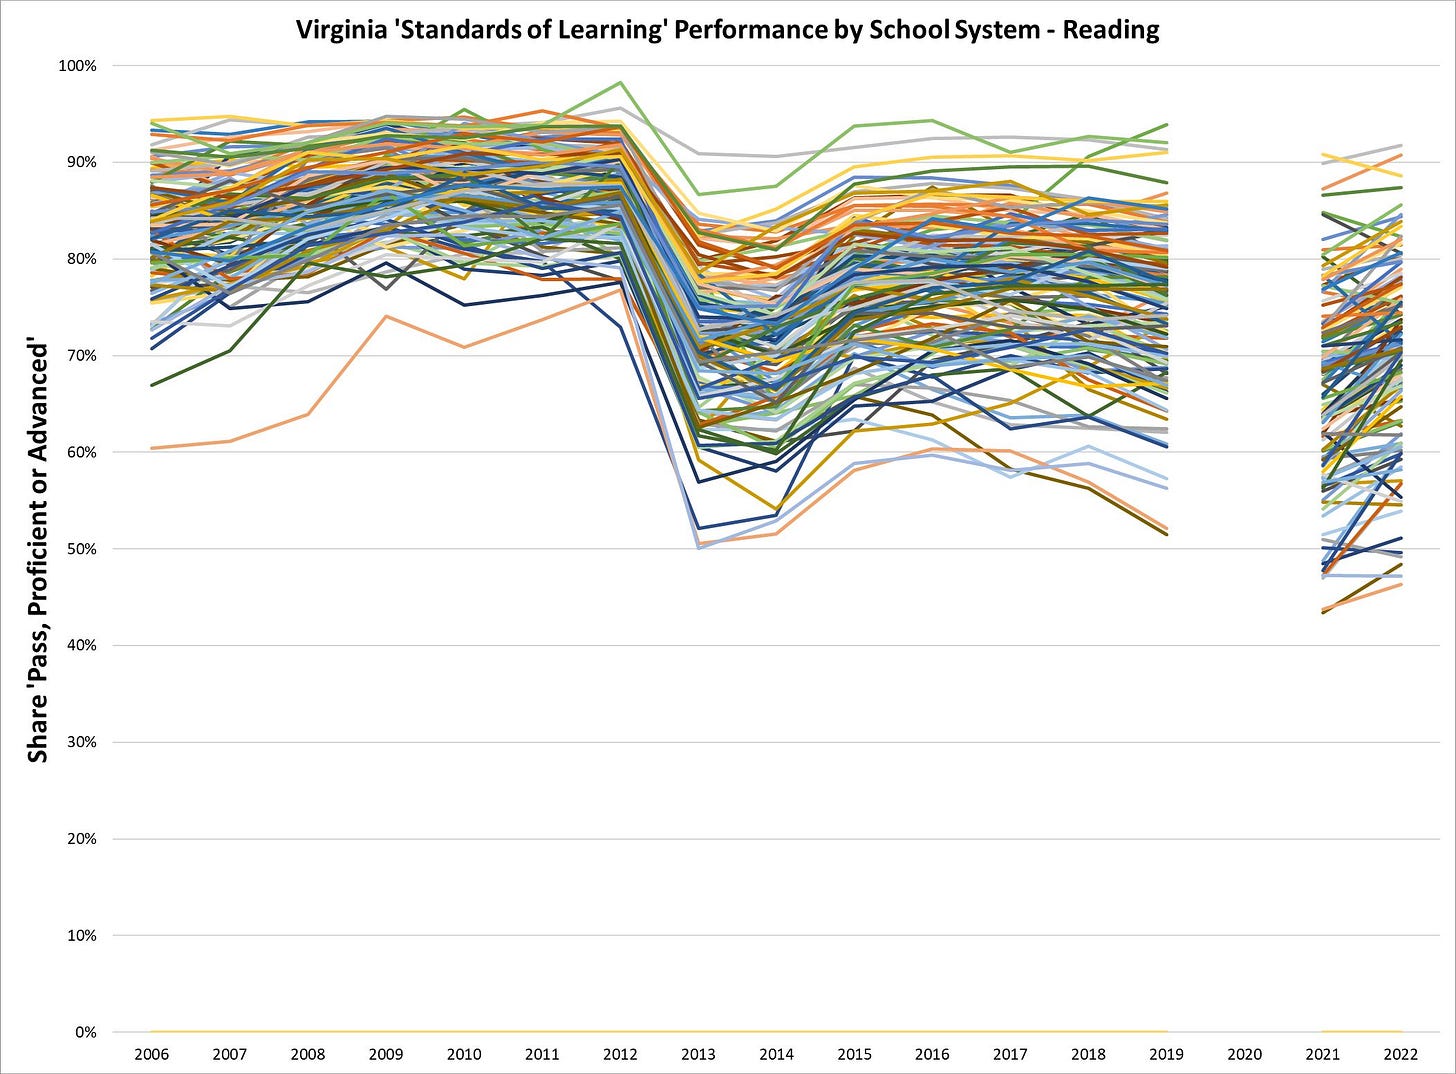
Performance in reading appears to have been the most resilient between 2019 and 2022. (See the coefficient estimates with respect to the COVID2022 dummy variable.) Performance losses between the other four subject areas are nontrivial and sizable, especially at the low end. Basically 10% to 13% more students were failing SOL exams in 2022 in Math, Writing, Science and History.
One can see the resilience of reading scores between 2019 and 2022, as compared to math scores, by comparing the following graph to the Mathematics graph indicated earlier in this essay:
I conclude by posting the results in Science, Writing and History below:
[1] One can find press releases at https://doe.virginia.gov/news/index.shtml.
[2] See, for example, the press release “State Superintendent Grants SOL Flexibility for 54 Schools,” dated July 25, 2011 at https://doe.virginia.gov/news/news_releases/2011/july25.shtml.
[3] The VDOE has posted this spreadsheet https://doe.virginia.gov/statistics_reports/enrollment/modes-instruction-attendance/2020-2021-mode-of-instruction.xlsx at https://doe.virginia.gov/statistics_reports/enrollment/index.shtml.
[4] I secured such numbers for 2010-2021 from Table 15 of the Superintendent’s Annual Report at https://doe.virginia.gov/statistics_reports/supts_annual_report/index.shtml.


An awful lot to digest and I'm not likely to even try, sorry. I need fewer factors with your best judgement to level the field. My days of instant understand of numbers expressed exponentially are behind me, alas. I remain stunned at the work but need it boiled down a bit. Perhaps the tables could form linked substack pages to tidy things a bit. There is just a lot there and I can't see the forest, forgive me professor.